Drupal Application Monitoring. A Comprehensive Guide with Tips and Tools
Efficiently running a Drupal website involves more than just content updates and design tweaks. Understanding application monitoring within the Drupal ecosystem is critical to maintaining web page performance and ensuring a seamless user experience. In this guide, you’ll learn about the importance of monitoring, and highlighting key metrics and practical tools.
What is application monitoring on Drupal?
Application monitoring on Drupal involves continuous tracking and analyzing various aspects of a website performance. This process includes monitoring server health, infrastructure, application performance, user behavior, content availability, and more.
The website monitoring process helps developers identify issues and bugs, track uptime, optimize resources, and ensure a smoothly functioning Drupal website by proactively detecting and addressing potential problems.
We can monitor applications through specialized tools or by gathering and examining logs directly in the system. The ultimate aim of application monitoring is to optimize availability and ensure online visitors receive the finest user experience possible.
Why website monitoring matters for your Drupal web page?
Drupal is a robust open-source CMS, but it’s still prone to different issues. With routine monitoring, you can identify problems in various areas and keep your website operating smoothly. Find out why it’s essential.

Optimal performance
Monitoring helps maintain peak efficiency by continuously analyzing system metrics and identifying bottlenecks and performance issues. Proactively addressing these concerns enables website administrators to fine-tune configurations and allocate resources effectively, ensuring consistent high-level operation across the Drupal website.
Enhanced user experience
Application monitoring ensures visitors have a seamless experience by making sure the website runs smoothly, reducing bounce rates, and boosting engagement. It also helps to understand what users like, allowing for improvements that improve their time on your Drupal website.
Security measures
Website monitoring identifies vulnerabilities and potential threats, enabling timely security patches and updates to keep your Drupal site safe. This process also ensures continuous protection against new threats, maintaining a solid shield around your website's sensitive information and user data.
Resource optimization
By keeping an eye on how your Drupal website uses resources, monitoring ensures the web page runs smoothly without wasting anything. This way, you'll avoid having too much or too few resources, ensuring your website performs well without unnecessary costs or inefficiencies.
Business continuity
The monitoring process ensures the website is available and functioning, minimizing downtime that could impact business operations. This prevents any potential loss of customers or disruptions to your services, providing a reliable online presence for your operations.
Key metrics to monitor on your Drupal website
Monitoring a Drupal website comprises several critical metrics that collectively reflect the overall health and performance of your online platform. These indicators provide insight into various aspects of web page functioning and meeting user expectations. Below are examples of key metrics to track.
Server uptime
Server uptime monitoring involves tracking and measuring the duration for which a server remains operational and can respond to user or system requests without interruptions. It focuses on ensuring that servers responsible for hosting websites, applications, or services are consistently up and running, providing access to users whenever needed.
This process involves regular checks and continuous observation of a server's status, typically through automated server uptime tools or services. The goal of this monitoring is to minimize downtime. It helps maintain reliability, user satisfaction, and overall performance by proactively identifying and resolving issues that could impact a server's availability or performance.
Server response time
Server response time measures how long it takes for the server to respond (that is, to process and return the information) to a request from a user's browser.
The longer response time directly impacts the speed at which your Drupal web page loads for visitors, significantly affecting user experience. Additionally, search engines like Google consider page speed as a ranking factor in their search results, meaning slower response times can lower the website's SEO rankings.
Consistent monitoring and optimizing this metric is critical to maintaining a responsive website. As a result, you can achieve fast and efficient interactions between the server and user browsers. That leads to improving overall user satisfaction and retaining a competitive edge in search engine visibility.
Database queries
Database queries represent the requests sent to the database to fetch information needed for a web page. Each time a user accesses a web page, multiple queries are often executed to retrieve various data elements like text, images, or user preferences.
High query counts or slow execution times can significantly slow down website speed and responsiveness, leading to longer loading times. Monitoring these queries on your Drupal website involves tracking their frequency, complexity, and speed of execution. Knowing this allows heavy operations to be optimized, using, for example, caching to reduce response time through data served from the cache. This optimization also reduces the strain on the server, allowing it to handle more simultaneous requests without compromising speed or functionality.
Website infrastructure
Infrastructure monitoring is pivotal for the Drupal website stability. By tracking server health, network performance, and resource usage, it proactively identifies issues, averting potential downtime and optimizing resource allocation.
This monitoring ensures a responsive web page, preemptively addressing bottlenecks. Beyond technical upkeep, it supports business continuity by aiding scalability decisions and maintaining optimal performance amid increased demands. Ultimately, infrastructure monitoring forms the bedrock of a reliable website and overall online success.
Error rates
Monitoring error rates encompasses keeping tabs on various issues users might encounter, such as 404 errors, server errors, or other operational glitches. These errors can disrupt the browsing journey and impact the website's functionality. Swiftly identifying and resolving these problems is crucial for ensuring uninterrupted website running and preventing potential complications from magnifying.
Additionally, consistently tracking error rates allows for identifying patterns or recurring problems and implementing preventive measures to enhance website reliability. By promptly addressing these errors, websites can safeguard their credibility and trustworthiness among their audience.
User traffic patterns
Understanding user traffic patterns includes monitoring metrics like visitor count, geographical distribution, session durations, page interactions, and more. By scrutinizing these patterns, you gain insights into audience preferences and behaviors, assisting in content customization and user journey optimization.
Knowing user preferences enables Drupal website owners to curate more relevant content and optimize navigation, fostering increased engagement and higher conversion rates. Continuously examining these traffic patterns allows for ongoing refinement, ensuring alignment with user preferences and improving website effectiveness.
Content availability
Content availability as a monitoring metric evaluates the accessibility and readiness of website content for users. It measures the consistency with which pages, images, multimedia, or other resources are available to visitors.
Assuring content availability involves monitoring server uptime, content delivery, and caching mechanisms. A website's credibility and user satisfaction depend on fast access to information. Any downtime or inaccessible content can hinder user interactions and lead to increasing bounce rates.
Consistent content availability positively impacts SEO, user engagement, and overall performance. Website administrators can ensure a reliable and seamless browsing experience by continuously monitoring and optimizing content availability, reinforcing the web page's competitiveness.
Page speed
Page speed refers to how quickly different parts of your web page load (like images and scripts). It’s a critical metric in website monitoring due to its direct impact on user satisfaction, overall performance, and search engine rankings. A swift-loading website significantly influences user behavior, affecting engagement, bounce rates, and conversions.
Monitoring page speed is paramount for website owners as it directly aligns with business objectives. It helps identify performance blockages, optimize content delivery, and enhance technical configurations.
To improve page speed, focus on things like reducing image load times, using caching, and optimizing the way your website delivers content. Faster web pages make users happier and more likely to stay on the website.
Functionality and processes
Monitoring functionality involves a comprehensive review of all functionalities on your Drupal website, including forms, e-commerce transactions, and user interactions, to ensure they operate flawlessly. Disruptions or malfunctions in these crucial elements can result in user frustration and negatively impact conversions. Immediate attention to rectifying such issues is imperative to maintain a seamless user experience and prevent potential revenue loss.
Proactive monitoring helps detect anomalies in functionality, enabling rapid troubleshooting and remediation to prevent extended downtime or usability issues. It also enables continuous improvement by identifying areas for enhancement or optimization, ensuring a consistently high-performing website that meets evolving user expectations.
Website monitoring tools for Drupal
To make website monitoring on Drupal effective, it's worth using tools. Here are examples of a few that deserve your attention.
Drupal built-in tools and Drupal Monitor module
Drupal's built-in monitoring capabilities include logging functionality that tracks and records system health metrics and error occurrences. The logging system in Drupal records various events, providing detailed insights into system activities, user interactions, and potential issues.
Viewing the logged data facilitates proactive identification of performance bottlenecks, security threats, or configuration errors. These features provide Drupal users with actionable data to quickly diagnose issues, fine-tune configurations, and maintain websites' overall health and stability.
In addition to the built-in features, you can also use a Drupal Monitor tool. It’s a module and a service that actively monitors websites. Thanks to a real-time dashboard and instant alerts, you can be immediately informed about issues that arise. When you operate a Drupal Monitor connector, the solution can collect data such as the number of users, nodes, last cron run, page requests, etc.
Third-party tools
You can also pick some third-party tools for different application monitoring types. Here is our subjective list of handy solutions.
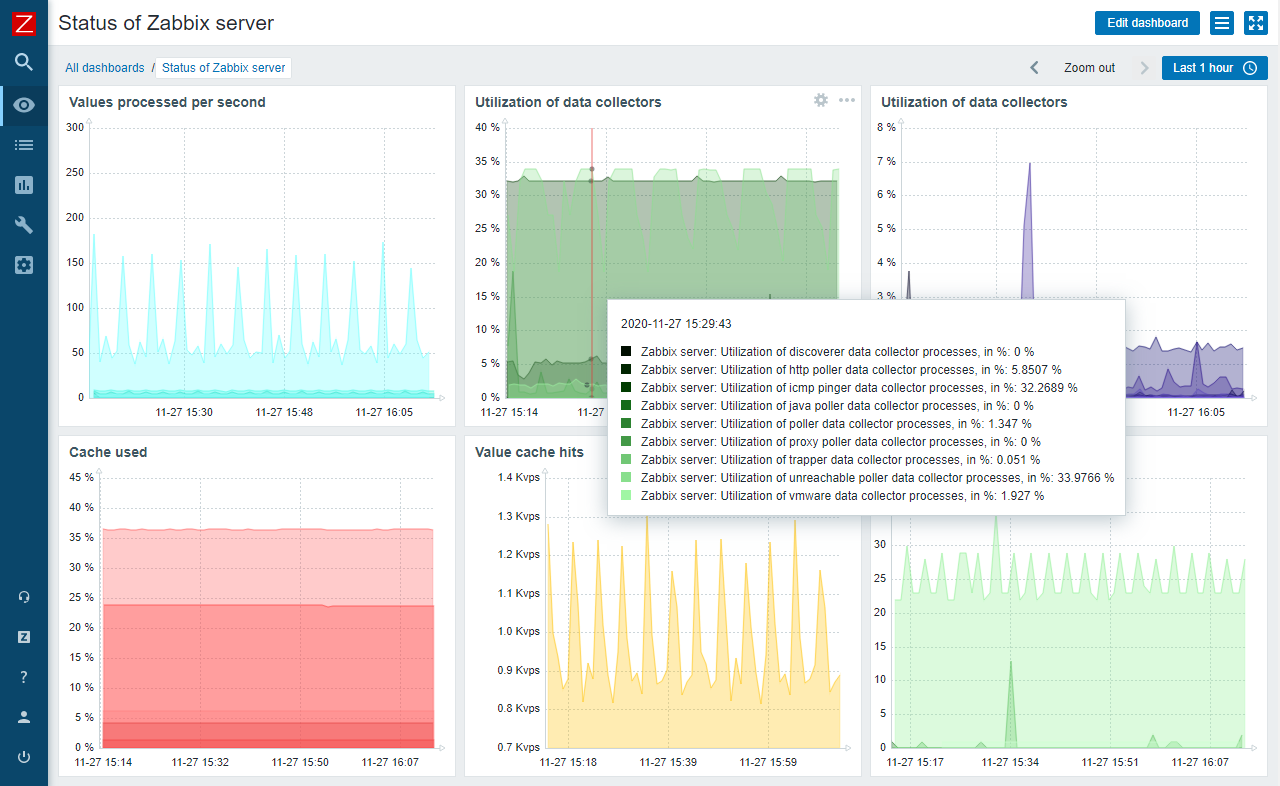
- Zabbix: a comprehensive monitoring tool designed to track and analyze various aspects of network infrastructure and systems' performance. It enables the identification of irregularities and issues. It offers detailed insights into network traffic, system health, and resource utilization.

Source: Zabbix.com/screenshots
- Cacti: a robust network monitoring and graphing tool designed to visualize and analyze network performance data effectively. It provides comprehensive insights into network traffic patterns, system health metrics, and device performance. The tool empowers administrators by collecting and presenting data on network bandwidth, device response times, and traffic trends.
- Nagios: a monitoring tool focused on tracking and ensuring the health and performance of IT infrastructure. It presents information about network devices, servers, and services. The tool provides real-time data on system availability, performance metrics, and potential issues, facilitating proactive identification and resolution of problems.
- Sentry: an advanced error-tracking tool designed to monitor and identify issues within applications. It offers detailed diagnostic data on code errors, crashes, and user-reported issues. The software delivers real-time information on bugs, allowing for prompt resolution and optimization of website performance.
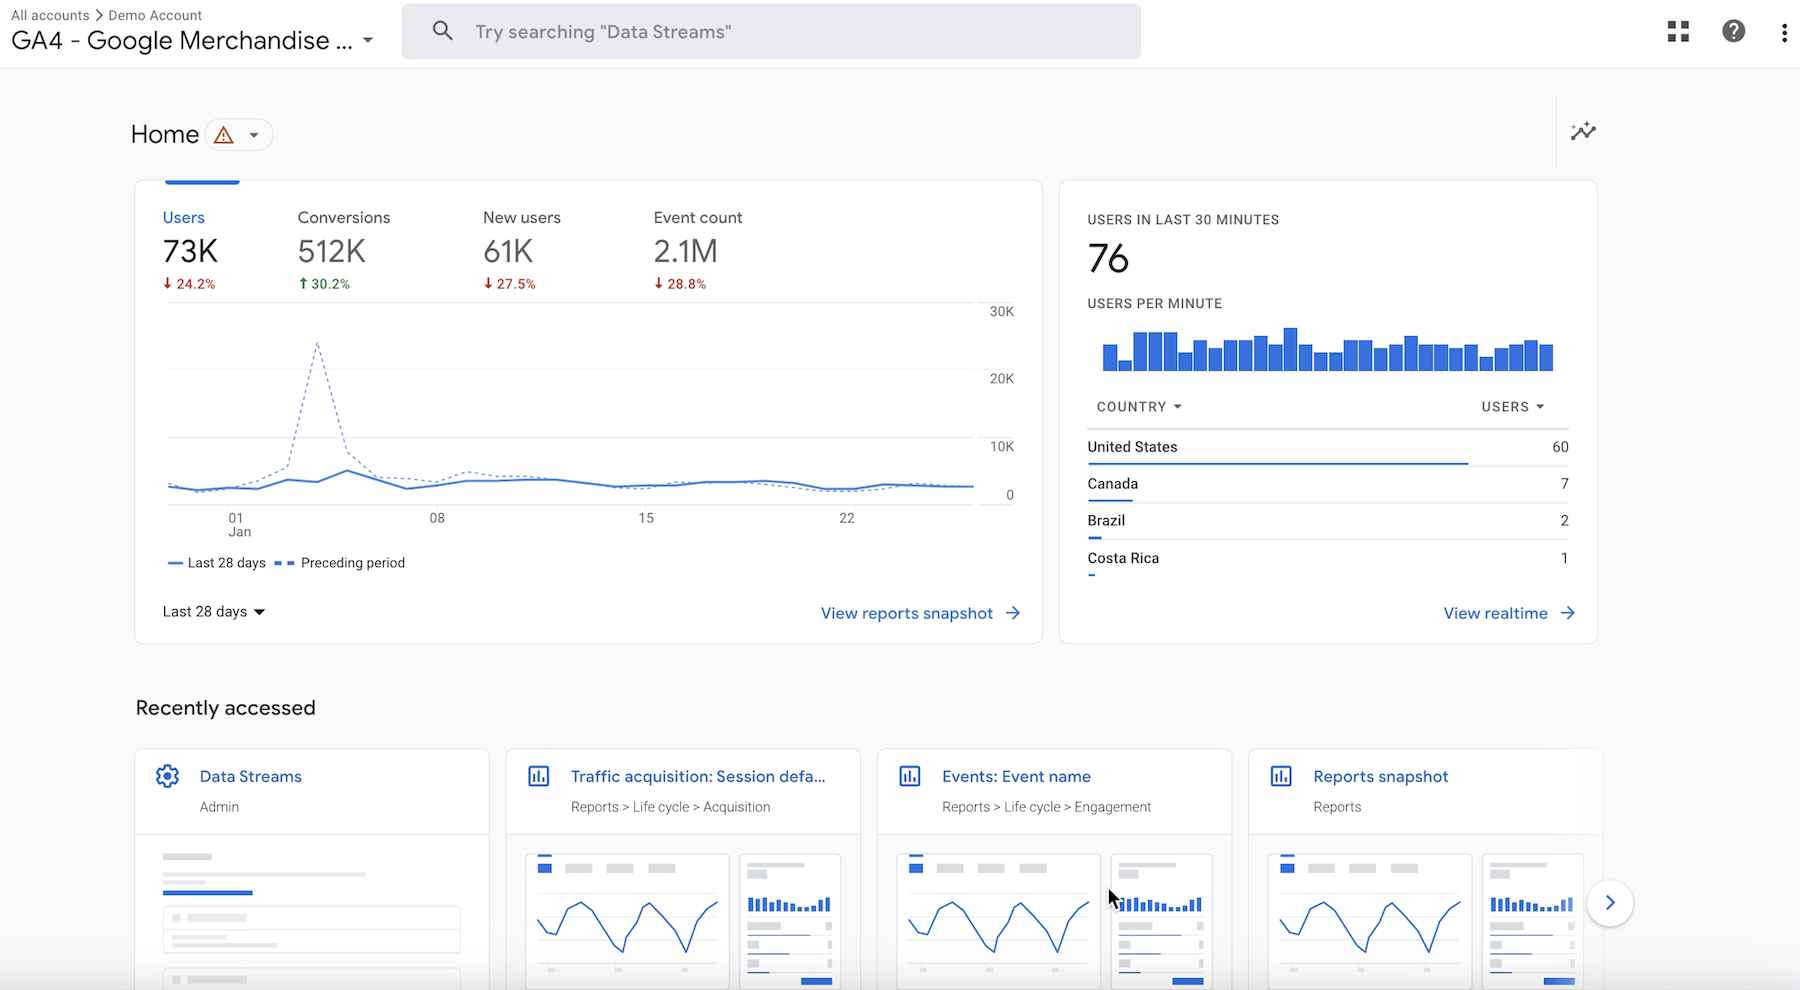
- Google Analytics: an online analytics platform that tracks user behavior, traffic sources, website engagement, and more to spot any anomalies. Beyond basic metrics, it provides in-depth data on user demographics, browsing habits, and device preferences, empowering website owners to tailor strategies for specific audience segments.

Źródło: support.google.com
Drupal application monitoring - summary
Monitoring your Drupal website is integral for maintaining optimal performance, security, and user experience. Tracking essential metrics and using appropriate monitoring tools ensures your web page operates smoothly, resolves issues promptly, and optimizes resources efficiently. If you need help with website supervision, our developers have years of experience implementing Drupal monitoring strategies


