What Server Uptime Monitoring Tools are Worth Using?

Server monitoring is a complex process of monitoring the entire server infrastructure and its dependencies in order to analyze the use of system resources and optimize them to provide services to end-users. It's undoubtedly one of the key elements for the efficient operation of infrastructures. Therefore, choosing the right server uptime monitoring tool is important for any company.
Why uptime monitoring is important?
Monitoring is a standard in the world of IT because it allows you to keep the company's servers in optimal condition. The server performance monitoring process itself is quite simple – it's based on regularly collecting server data and its real-time or historical analysis. Thanks to this, we can ensure that the servers work optimally, thus fulfilling the intended function.
You may monitor almost everything, including processor performance control, memory consumption, network, and disk space bandwidth, as well as identification of problems related to the use of servers. However, just knowing how to monitor your server isn't enough. It's necessary to understand why it's such an important part of the organization's security. The aim of monitoring is to inform about failures and performance issues and solve problems in advance. In practice, this means that failures or anomalies are being detected so fast that the entire enterprise's service, application, or operation isn't stopped. As a result, the company's server infrastructure works in a proper and stable manner, and the organization doesn't suffer losses caused by long interruptions in the system operation.
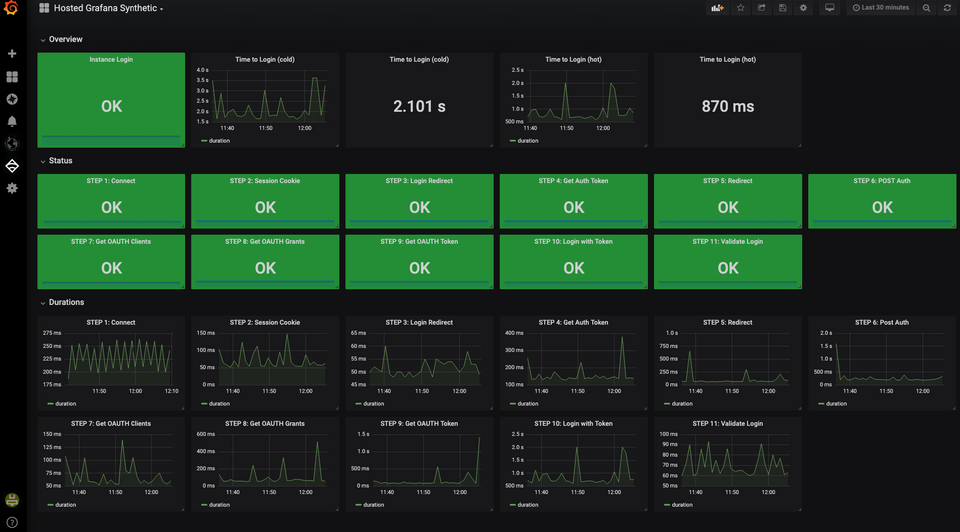
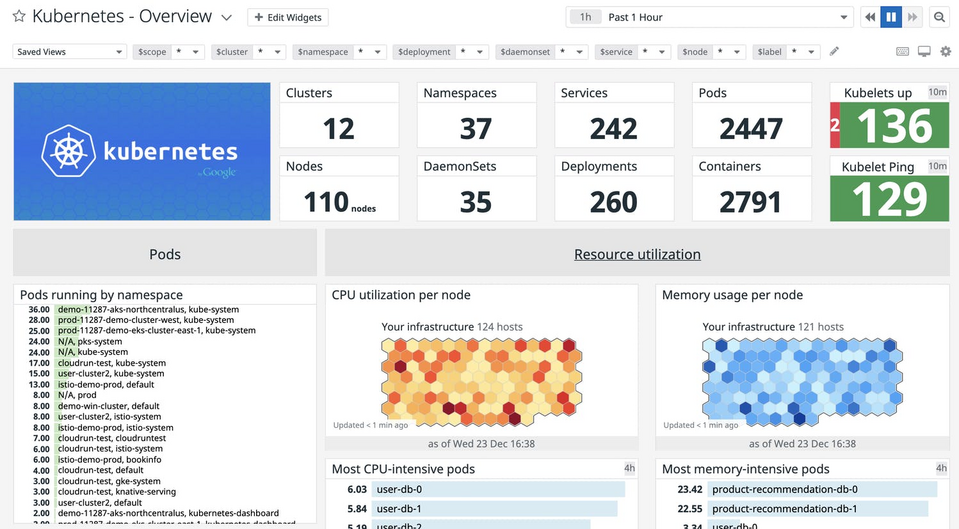
Source: Grafana
How do you know a server is down?
Proper and uninterrupted server monitoring ensures that the server is running and that it's properly optimized. In addition, it enables to minimize the risk of interruptions in the system's operation, and when a failure occurs – to perform a precise analysis of the processes, which will lead to a quick repair. However, no one can never predict the future, and everything may happen – the application will stop working, the server will run out of resources, there'll be a problem with the availability of ISP services, etc. In such a case, the information about the web page or other unavailable services should be provided by the monitoring system, not by the company's CEO or the end-user. To avoid such situations, you should implement an appropriate monitoring tool that'll help prevent possible problems and failures by informing administrators or responsible departments about them.
1. Zabbix
It's the unofficial leader in the field of monitoring. The origins of this tool date back to 1998, and its creator and founder is Alexei Vladishev, who still very actively develops his product. Zabbix is an open source solution based on GPL (General Public License), making it free for commercial and non-commercial use. So far, the program has a dozen or so versions, and currently, its most popular version is 5.0 LTS, with five years of long-term support, which is ideal for the production environment. The following release got the number 5.4, and 6.0 LTS has been released recently, while the roadmap informs about the plans for more versions – up to 7.0 LTS. Each new version includes a number of new changes, taking into account the needs and requirements of the dynamic IT market. Version 6.0 introduces new functionalities. The most interesting among them are Kubernetes clusters monitoring, detecting anomalies based on machine learning, and expanding the monitoring in terms of business.
The Zabbix system allows for monitoring devices supporting the SNMP, IPMI technologies, and the ICMP, TCP, UDP, HTTP protocols, as well as for creating your own elements for monitoring. Hardware monitoring includes desktop computers, physical servers, virtual servers, network drives, switches, routers, Windows and Linux environments, and many more. Zabbix's functionalities are huge and allow you to monitor, for example:
- load of processors, network cards, and memory, the amount of space on hard drives,
- websites and web applications,
- standard network protocols: SMTP, ICMP, SSH, TELNET, IPMI, JPX, HTTP/ HTTPS,
- distributed locations (branches or subsidiaries),
- validity of SSL certificates on web pages,
- temperature of individual components,
- correct execution of an SQL query.
To monitor the resources listed above, you may use the ready-made, free templates or create your own ones.
Zabbix's architecture consists of several elements. The most important of them is Zabbix Server, which is responsible for data reception, aggregation, and processing, as well as for generating events on its basis and detecting anomalies. For selected incidents, you may send alerts in the form of an SMS, email, or by using Webhook for integration with the most popular helpdesk systems, chats, and messengers (e.g., Microsoft Teams, Messenger). Another element is Zabbix Agent, which collects the operating system's metrics locally. This daemon, available in UNIX and Windows systems, has low resource consumption and is able to run in both passive and active modes. In the passive mode, the agent processes the request from the server together with the list of parameters that it should control and returns the collected data to it. In the active mode, the agent establishes communication with the server first and regularly sends data to it. This mode is useful when the server can't communicate directly with the agent for some reason. Thanks to its numerous built-in templates, the agent can check many parameters without additional configuration. An optional element you may use is the Zabbix Proxy server, which mediates communication between Zabbix Agent and Zabbix Server. Such a solution is worth applying in an infrastructure distributed among many locations, e.g., company departments, locations with poor connectivity, or places without local administrators.
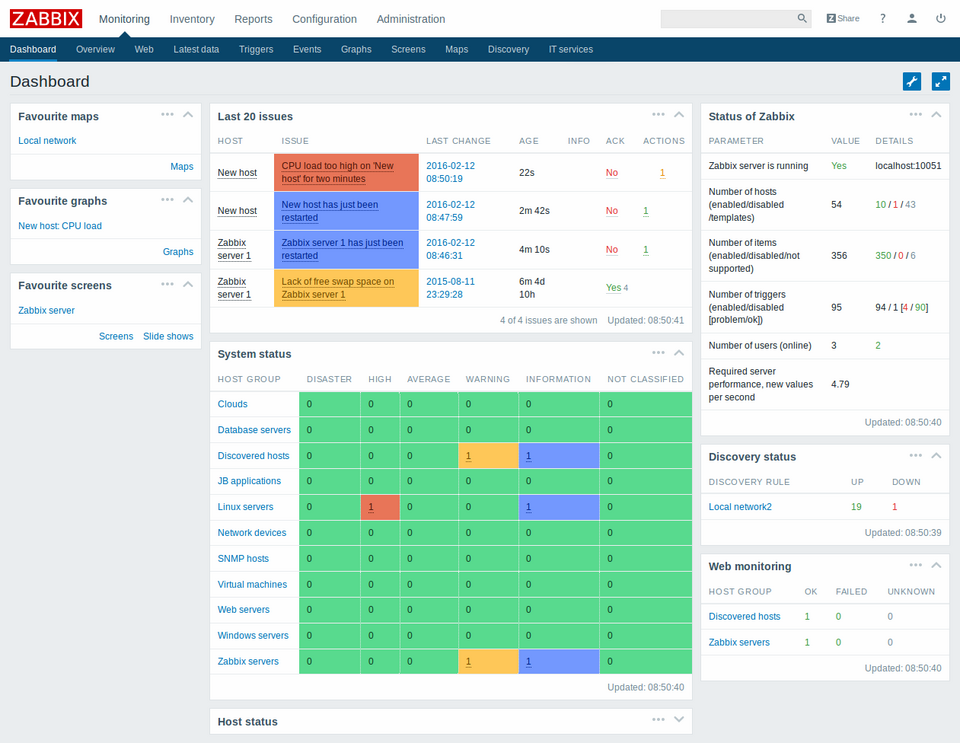
Source: Zabbix
Zabbix also offers a broad set of integrations with various systems and platforms. Among the huge number of these, amounting to over 500 tools, noted should be the integrations with:
- the largest cloud service providers (e.g., AWS, Azure, Google),
- containers (e.g., Docker, LXC),
- ticket systems (e.g., Jira, OTRS),
- configuration management systems (e.g., Ansible, Puppet),
- messaging systems (e.g., PagerDuty, Slack).
The great advantage of Zabbix is its community and the possibility of acquiring knowledge through many support channels (including Support System, Telegram, Discord, Zabbix Forum). For more demanding customers, the manufacturer has prepared five different levels of support – depending on the expected needs.
2. Nagios XI
Nagios XI is a system for monitoring corporate infrastructure originating from the open source world. This software was created based on the Nagios Core engine, which over time has been enriched with the functions adapted to business customers. Nagios Core remained a free tool, developed under the GNU GPL v2 license, while Nagios XI has turned into a fully commercial solution.
The architecture of Nagios XI is based on the family of Linux/Unix systems with dedicated systems for installation: CentOS, Redhat Enterprise Linux, Ubuntu, and Debian. However, the tool may also be deployed on Windows, using the VMware Workstation Player or Hyper-V virtual environment. This tool has unlimited possibilities and is used for comprehensive infrastructure monitoring. In addition to monitoring critical infrastructure elements, i.e., network devices and protocols, applications, operating systems, databases, Nagios XI offers the monitoring of computing resources, the control of environmental parameters, and IoT. The clients may choose from two versions of the product: Standard Edition and Enterprise Edition.
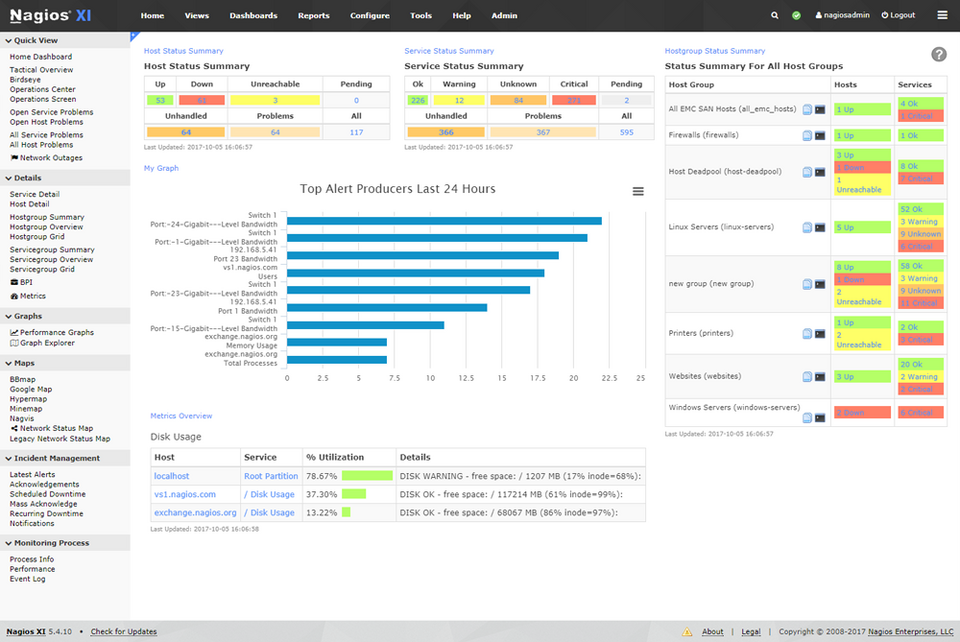
Source: Nagios
Even though Nagios XI is a commercial tool, the manufacturer offers a free license covering up to seven nodes, which can be extremely advantageous for home use – among the examples are:
- monitoring the condition of the home file server (storage, temperature),
- monitoring the status of the printer (ink and paper level in the printer), router or switch,
- using in a smart home together with Raspberry Pi and collecting sensor data and providing data on, e.g., groundwater level, sunlight, or even acidity (pH) of the soil, and garage door status alerts based on the time of day.
The tool is operated from the browser level, and the interface itself is simple and clear. However, there's room for improvement here, as the UI clearly differs from the current trends.
On the other hand, the Nagios XI's configuration wizards are intuitive, easy to use, and don't require complex IT infrastructure monitoring process knowledge. The collected data is used for charts, event logs, statistics, trend analysis, as well as resource and performance planning. Any alerts concerning, e.g., unavailability of services or exceeding critical values, are sent via e-mail and SMS.
The system's capabilities may be extended thanks to a wide range of third-party add-ons available under the GPL license. Nagios XI also has an extendable architecture with the ability to use any preferred programming language. The system provides many APIs, ensuring easy integration with internal and external applications.
3. Prometheus
Prometheus, referred to as an open source system monitoring and alerting toolkit, was created in 2012 by former Google employees. Initially, it was intended to be used only for monitoring containerized environments, but it expanded its capabilities to applications, servers, databases, and virtual machines over time. Currently, the system is intensively developed in cloud environments.
Prometheus is an independent open source tool, actively supported by a community of developers, and all its components are available under the Apache 2 license on GitHub. However, this doesn't prevent large companies from using this system as a key infrastructure element. Among the clients are, e.g., DigitalOcean, Docker, Showmax, or SoundCloud. In addition, the strength of the tool is evidenced by the fact that Prometheus joined the Cloud Native Computing Foundation as the second project after Kubernetes. Only the providers of the fastest developing open source projects receive such a distinction.
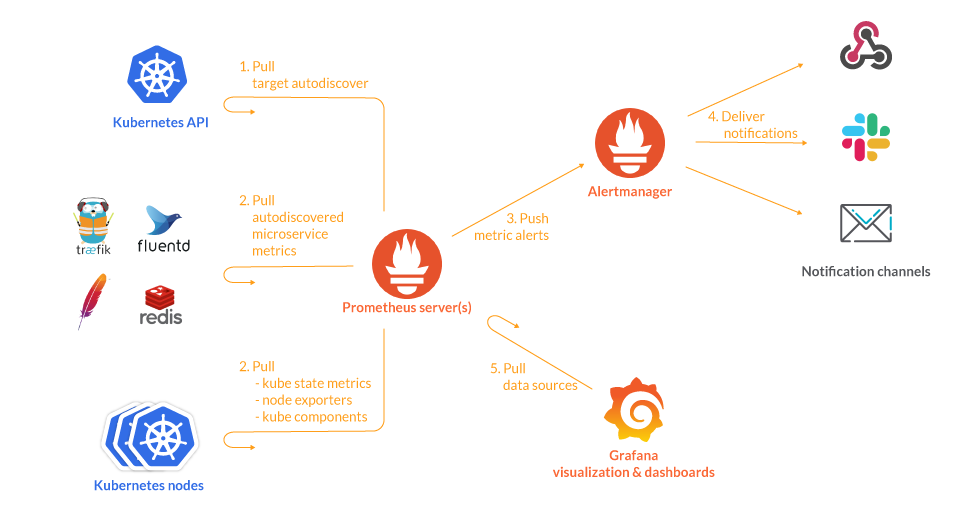
The key element of this tool's operation are the metrics that characterize a given application or instance and provide information about them. Client libraries for Prometheus offer four main types of built-in metrics which are able to provide various data, e.g., the number of HTTP requests and errors (the Counter metric), the response time (Histogram), memory usage (Gauge), and the number of active users (Summary). Each metric is being assigned a name that may be referenced, together with optional key-value pairs called labels. Prometheus collects metrics based on push and pull methods. In the former method, the monitored application is responsible for sending its own metrics to the monitoring system by Pushgateway. However, in the pull method, the application is passive and only prepares its metrics in the form of an endpoint, while Prometheus decides when to download them based on the rules. This server uptime monitoring tool has an efficient built-in time-series database, so the information about metrics is stored with the time stamp indicating the time when they were recorded.
One of the pillars of the tool is Prometheus Query Language (PromQL), used to query and aggregate monitoring data in real-time, using a variety of operators and functions. The independent Alertmanager application is used to automate the monitoring, which generates and sends alerts when certain conditions are observed. Prometheus provides a broad set of exporters in order to monitor virtually everything, but it doesn't have the ability to visualize the collected data itself. This is where Grafana comes in handy, where dashboards connect with data sources to visualize metrics almost in real-time. The specialists of both solutions cooperate intensively with each other, developing the already advanced integration with Prometheus in Grafana and providing the Grafana clients with access to the Prometheus functions they need.
The cooperation with the largest provider of cloud services, Amazon Web Services, also brings great results. Last year, Amazon Managed Service for Prometheus was launched. It's fully compatible with Prometheus, has high availability, automatically scales as the needs grow, and includes the AWS compliance and security suite. The service allows for collecting metrics from the Amazon Elastic Compute Cloud (Amazon EC2), Amazon Elastic Container Service (Amazon ECS), and Amazon Elastic Kubernetes Service (Amazon EKS) environments.
Source: Sysdig
4. Datadog
It's a complete solution for monitoring and analyzing infrastructure and applications. The tool enables visualizing the collected data and sending notifications on technical problems, helping the administrators to detect critical errors and fully control IT systems. Datadog operates in the SaaS model and is used in cloud-based, hybrid or local environment infrastructure. Its scope includes traditional infrastructure monitoring, real-time application performance monitoring, network activity, and traffic analysis, monitoring the performance of databases, DNS, and bandwidth.
Datadog aggregates metrics and events in one place, makes it possible to analyze them easily and distinguishes the current values of critical KPIs, SLOs, and SLAs. Transparent and dynamic dashboards are used for this, without the need for using query language or coding, with a wide range of libraries with formulas, functions, and drag-and-drop widgets.
Solving problems, alerts, and creating charts is possible thanks to over 500 integrations, among which you may find cooperation with Amazon Web Services (AWS), Microsoft Azure, Google Cloud Platform, OpenStack, or Red Hat OpenShift. In addition, Datadog is compatible with the metrics of the increasingly popular DevOps tools – Kubernetes and Prometheus. The advantage of the system is also log management. Collecting logs from all services, applications, and platforms, searching and filtering them, automatic tagging, visualizing, and alerting of log data – all of this means more effective monitoring. Solutions based on artificial intelligence are being used to detect any anomalies. Alerts about problems in the environment are being sent via e-mail, PagerDuty, Slack, Hangouts Chat, and Microsoft Teams. The strength of the Datadog system is demonstrated by the size of its clients. It's used by brands such as Samsung, Siemens, Lego System, Sony, and Lufthansa Systems.
Source: Datadog
5. Sematext
Sematext is a solution for infrastructure and application performance monitoring, as well as log management. The tool may be used in the Cloud or Enterprise version. While Sematext Cloud is a fully managed SaaS service, Sematext Enterprise is a ready-made package to be downloaded and run in your infrastructure. Both versions contain the same service package and enable complete infrastructure visibility, container, and database monitoring, application performance control, log management, and alerting. The increasingly popular cloud version is characterized by high availability, scalability, and performance, as well as service monitoring in private, public, and hybrid clouds. To start working on hosts, an agent that automatically recognizes the elements to be monitored is required. Hosts can be any physical machines, systems in virtual environments, containers (Docker, ECS), or clusters (EKS, Kubernetes).
Sematext offers fully managed Elasticsearch and Kibana services without the need for expensive specialists and infrastructure, saving you time on system maintenance. The interface and operation of the dashboard are user-friendly and allows for:
- filtering and analyzing metrics and events,
- data searching,
- creating custom dashboards and reports,
- generating custom alerts based on service performance,
- solving performance problems,
- and detecting trends and patterns.
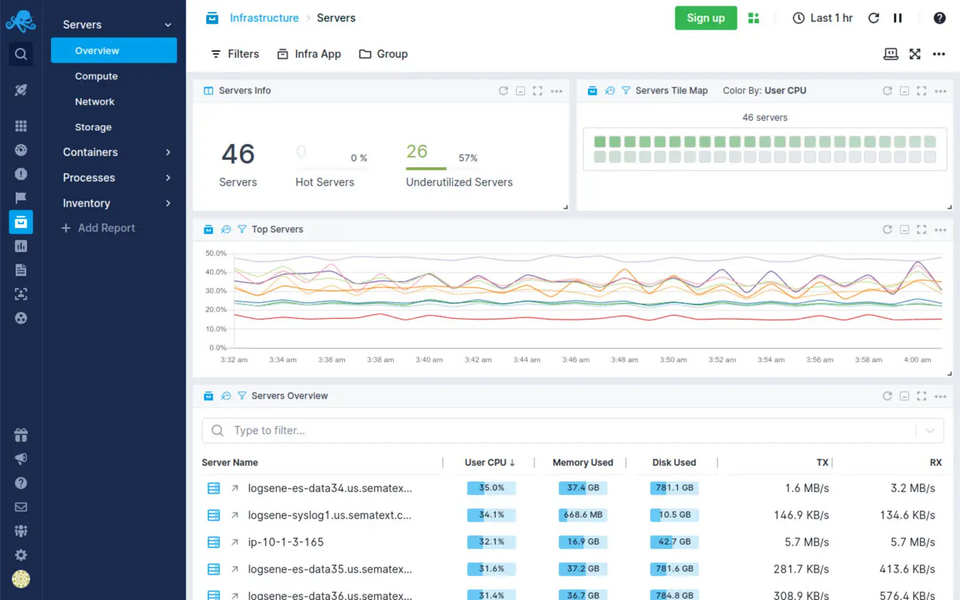
Source: Sematext
Log management is performed by the Sematext Logs service, which collects log messages and analyses them in real-time using a hosted version of the ELK stack in the cloud or locally. The tool allows for storing, indexing, and searching logs of various types (application, server, container, custom event, mobile application logs) and aggregating logs from multiple sources. The log sending process takes place via the Elasticsearch API or Syslog.
Alerts in Sematext are used to notify about the fulfillment of at least one of the predefined conditions in metrics, logs, or data based on historical data. The most important types of alerts include:
- classic alerts – based on thresholds and triggered when a given threshold is exceeded,
- anomalies – they are based on statistics and are triggered when values suddenly change and deviate from the constantly calculated baseline,
- heartbeat – run when Sematext stops receiving data from the server, container, application, etc., for a specified period of time.
Alerts integrate, e.g., with Slack, PagerDuty, Teams, Google Chat, as well as e-mail.
Sematext is developing mainly towards the cloud, so it works very well with the largest cloud providers, i.e., AWS, Microsoft Azure, Google Cloud Platform, DigitalOcean and IBM Cloud.
Sematext is a large player on the IT monitoring market, as evidenced by the fact that among its clients are the companies such as eBay, Dell, Instagram and Microsoft. For its clients, the manufacturer has prepared three plans: Basic, Standard and Pro, for each of the four modules: Logs, Monitoring, Experience, Synthetics. Each module may be tested during a 14-day trial period. Sematext provides the InfluxDB and Elasticsearch APIs for metrics, logs, and events, making the integration with external systems easy.
Server uptime monitoring tools – summary
A server monitoring system enables uninterrupted control of the IT environment. The right choice and implementation of a monitoring tool ensure proper maintenance of services, as well as security, stability, and comfort when running a business. Appropriate configuration with the alerting function allows for a quick response even before a problem in the infrastructure occurs. As part of our DevOps services , we can help you choose and implement a solution that'll best suit your company's needs.