
Technical Audit of Drupal in 20 Minutes. How to Use the Druscan Tool?

Changing the agency that supports your Drupal system or obtaining quotes from several companies usually requires sharing the technical details of your project. The problem is that the database contains customer data, the configuration stores API keys, and the custom code reveals the company's business logic. In this article, I’ll show you an open source tool that solves this problem. Druscan collects all the technical information needed for analysis, while protecting sensitive data. I invite you to read the blog post or watch an episode from the “Nowoczesny Drupal” series.
In this article:
- The challenge: how to estimate Drupal project costs without exposing sensitive data?
- What is Druscan and how does it work?
- What data does Druscan collect during a technical audit?
- What data does Druscan NOT include in its technical audit?
- What are the technical requirements, and how do you install Druscan?
- What does a Druscan technical audit report look like?
- Demo: how a Druscan technical audit works on a real project
- What are some other uses for Druscan?
- Drupal technical audit with Druscan – summary
The challenge: how to estimate Drupal project costs without exposing sensitive data?
Let's say you run a Drupal-based system and plan to entrust its maintenance to a new company. You may also need quotes from several agencies to upgrade Drupal 8 to the latest version, or you’re preparing a major change to a project that you’ve maintained yourself until now. In each of these scenarios, it’s necessary to provide basic technical information.
However, after sending out requests for proposals, a series of detailed questions quickly arise: how many modules are installed? Does the project include custom modules? What does the data architecture look like? How much content does the system store? To answer these questions accurately, companies usually need access to the database, code repository, or even the server.
And this is where the real problem begins. The database often contains customers' personal data, the custom code reflects business logic, and the configuration stores API keys for external services. Sharing such resources with multiple entities involves risk. You cannot be sure who will have access to them or how they will be secured.
In addition, preparing a stripped-down version of the database or code can be time-consuming. On the other hand, without technical details, agencies are unable to prepare a reliable quote – they may significantly overestimate the cost or refuse to provide an estimate altogether.
This raises a fundamental question: how can you convey the necessary technical information without revealing sensitive data? The answer is Druscan.
What is Druscan and how does it work?
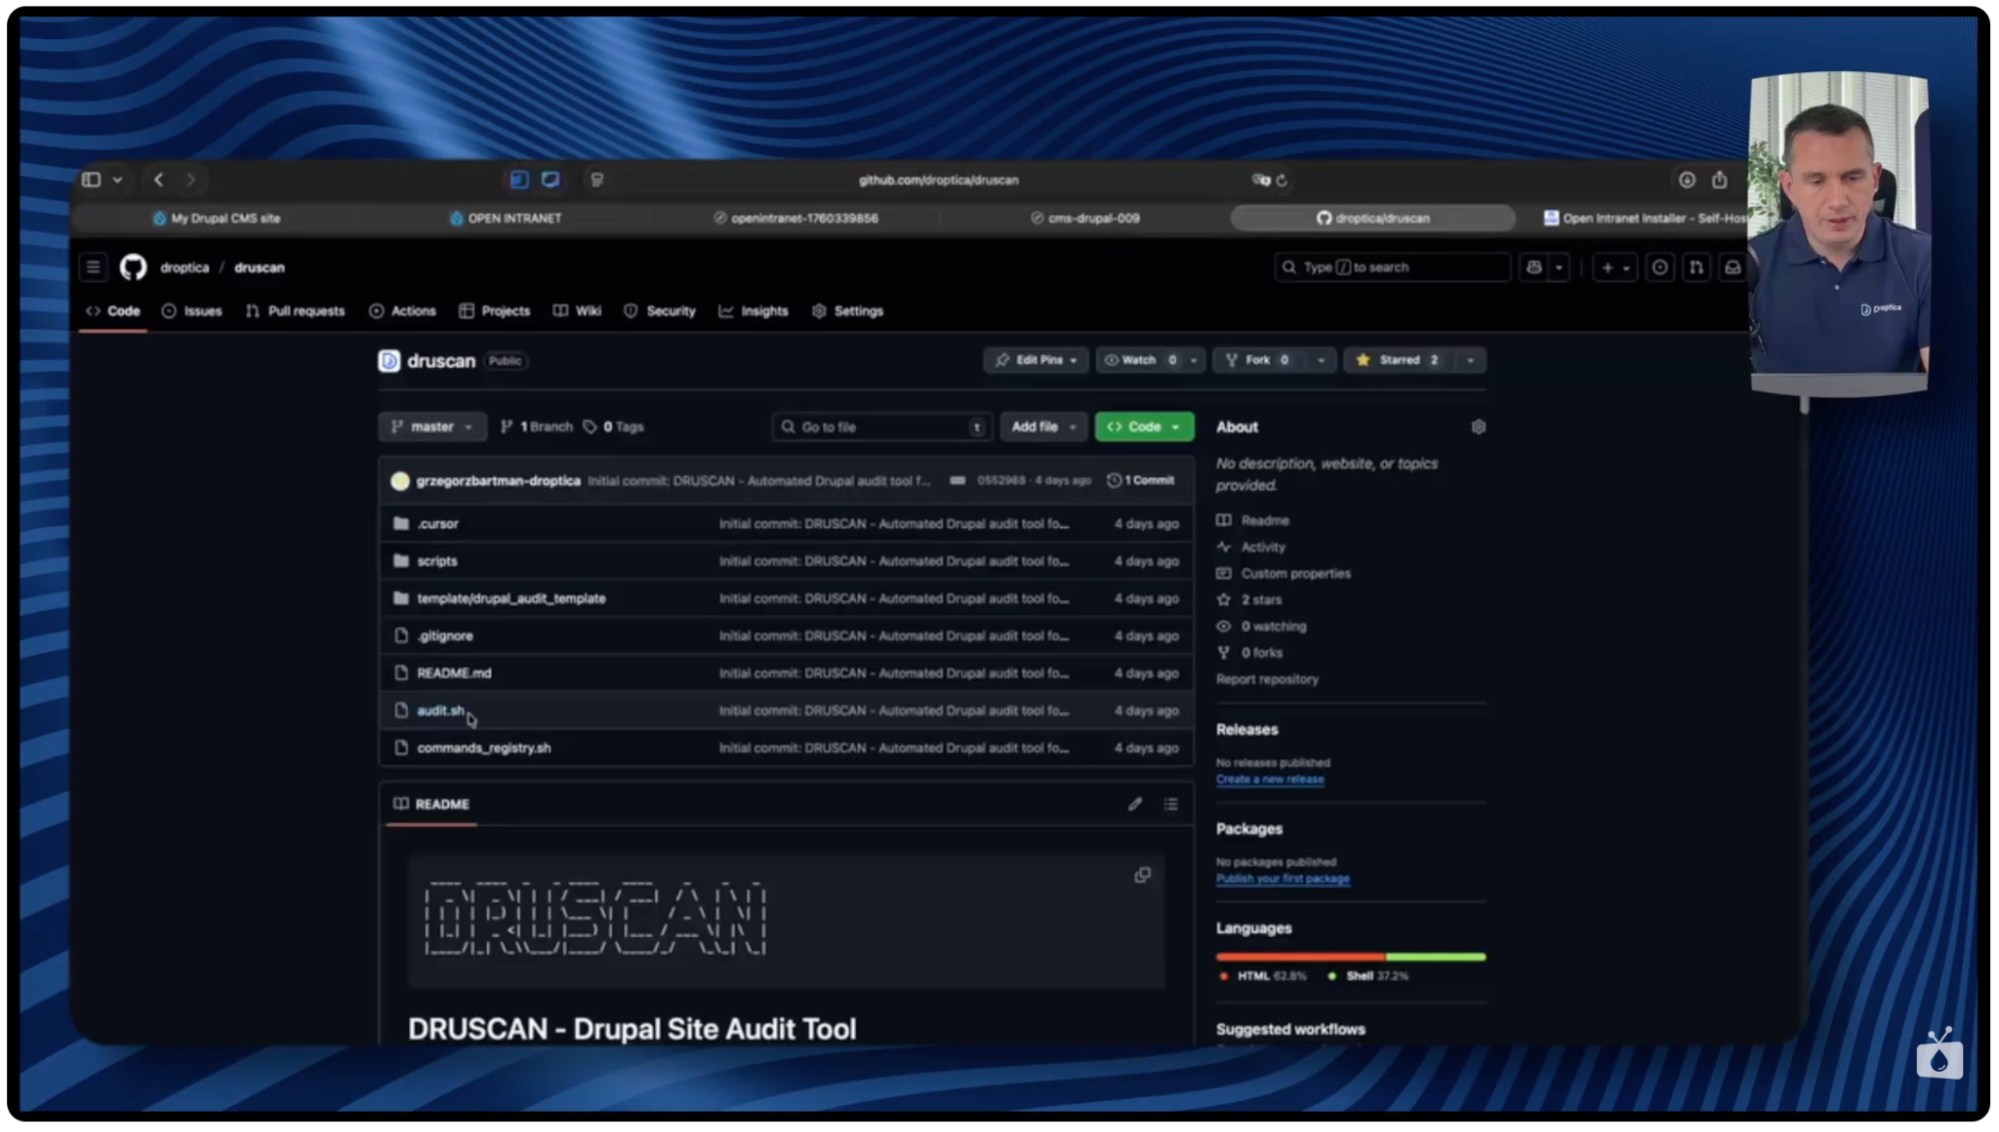
Druscan is an open source tool for technical auditing of Drupal, which we created at Droptica and made available for free as a GitHub project. It was created to enable reliable system analysis without the need to share the entire database or source code with external companies.
In 2024, we also developed a practical script specifically designed to analyze projects migrating from Drupal 7. If you’re still using this version and are considering migration, you’ll find a tool for estimating the costs of migration from Drupal 7 to 11 in our blog post. Druscan has similar assumptions, but covers a much wider range of data and functions.
The tool collects all the information necessary for a technical assessment of the project, without revealing any sensitive data. This allows you to prepare a complete picture of the system needed for valuation or analysis, while maintaining full information security.
What data does Druscan collect during a technical audit?
The tool performs an automatic technical audit of the Drupal system and collects detailed information from over twenty areas. Below are some examples of the analysis elements.
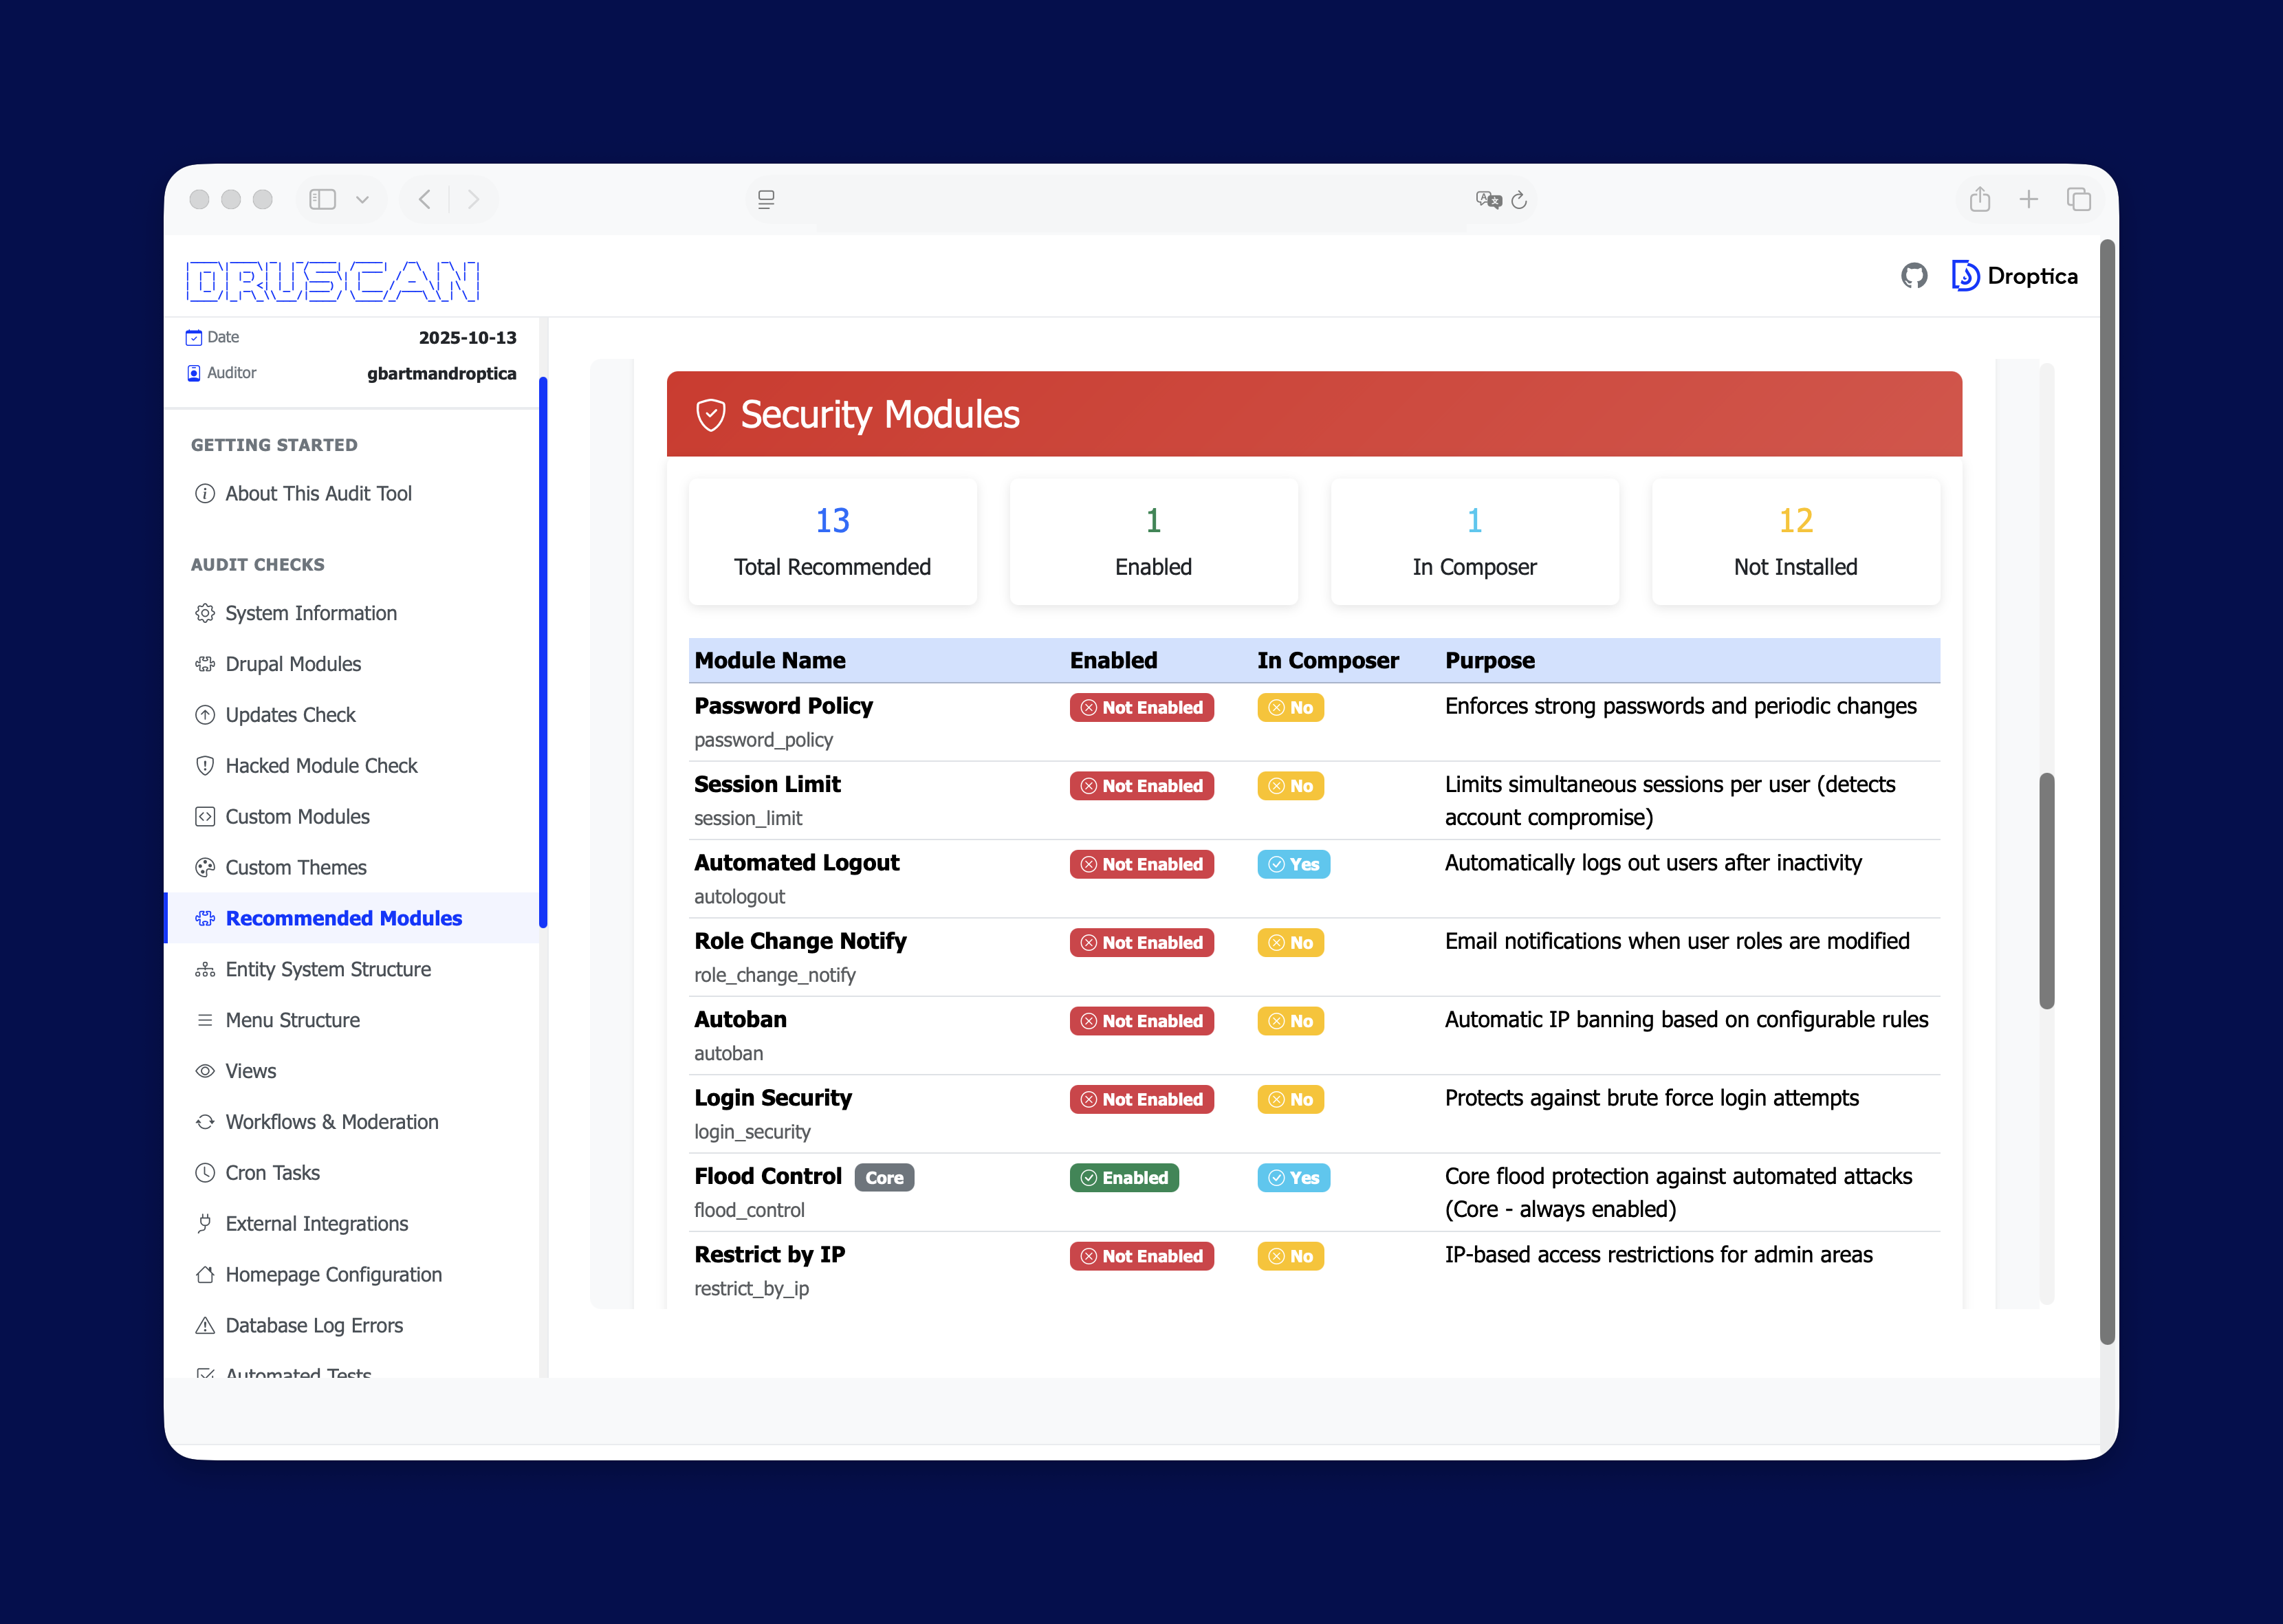
List of modules
Druscan retrieves a complete list of modules installed in the system, distinguishing between Drupal core, contrib and custom modules. For each of them, it records the version, activation status, and information about the patches applied.
For custom modules, the report includes, among other things, the number of lines of code and defined routings. In subsequent updates, the tool will be expanded with additional metrics still without revealing the content of the code.
Content architecture
Druscan also analyzes the content architecture in the system: content types, number of fields, taxonomies, media, users and roles. It also checks the configuration of views, whether they’re pages, blocks, and what types they are. Additionally, it verifies workflow and permissions, which allows for a better understanding of content management logic.
Performance metrics
The tool evaluates key performance parameters, tests compliance with WCAG, and analyzes errors recorded in the event log (dblog). It also checks whether there are automated tests in the project, which can be an important indicator of code quality and maturity.
External integrations
Druscan identifies Drupal integrations with external services, among other things, by analyzing modules responsible for communication with APIs or other systems. The collected data is saved in reports in JSON and HTML formats, making it easy to view or use for further analysis.
What data does Druscan NOT include in its technical audit?
Just as important as what information Druscan collects is understanding what is deliberately not included in the report. The tool is designed to protect all sensitive data stored in the Drupal system.
No database content
Druscan doesn’t collect or store any content from the database. Articles, product descriptions, user data, or other information stored in Drupal tables won’t appear in the reports. The tool doesn’t copy any text content or business data.
No custom module code
The report doesn’t contain the content of custom module code. Druscan only provides general metrics, such as the number of lines of code or information about the existence of a module, without revealing the business logic. The code remains fully protected.
No API keys
Druscan doesn’t collect API keys or any configuration elements that could enable unauthorized access to external systems. Sensitive settings remain exclusively in your environment.
No files or media
The audit doesn’t cover multimedia files or documents stored in the system. The report doesn’t include a list of photos, attachments, or other resources. All private files remain outside the scope of the analysis.
What are the technical requirements, and how do you install Druscan?
Druscan runs in an environment based on DDEV, so the Drupal system to be technically audited should be run using it. DDEV is a local development tool, which means that the entire analysis process takes place on your computer. No data is sent to external servers.
Installation and running the scan are very simple. In the Druscan directory, create a symlink pointing to the Drupal project directory, and then run the audit script. The entire process usually takes about 15-20 minutes, depending on the complexity of the analyzed site, and the result is a complete technical report.
Druscan's two modes of operation: basic and advanced with AI
Druscan offers two modes of operation, allowing you to tailor its operation to the specifics of your project.
Basic mode: shell-script audit
In its basic version, Druscan runs as a shell script that collects raw technical data about the system. You can then analyze this data yourself or pass it on to agencies preparing a valuation. This mode doesn’t require any additional tools other than DDEV.
To run it, call the command with two parameters:
- the name of the project directory,
- the website URL (local or production).
The URL is used, among other things, to perform tests of page speed and WCAG compliance analysis.
Advanced mode: AI-powered analysis and recommendations
The second mode uses the Cursor tool, designed to work with code with the support of AI. In this variant, Cursor first runs a standard data collection script and then, based on the generated files, creates an analysis and a list of recommendations along with time estimates for individual tasks.
To use this mode, you must first prepare the configuration in the .cursor directory, defining the appropriate command with a prompt. After saving the configuration, you can run the audit by typing a slash (/) and selecting the prepared command from the list of available options.
What does a Druscan technical audit report look like?
As I mentioned above, Druscan analyzes the system in over twenty areas. The generated report presents this data in two formats:
- JSON – useful for further automatic analysis or AI tools,
- HTML – a clear report that can be conveniently viewed in a browser.
After starting the audit, a new folder marked with the date is created in the Audit Reports directory. As the tool runs, subsequent JSON files are added to it, each corresponding to a different area of analysis, including information about the database, list of modules, or available updates.
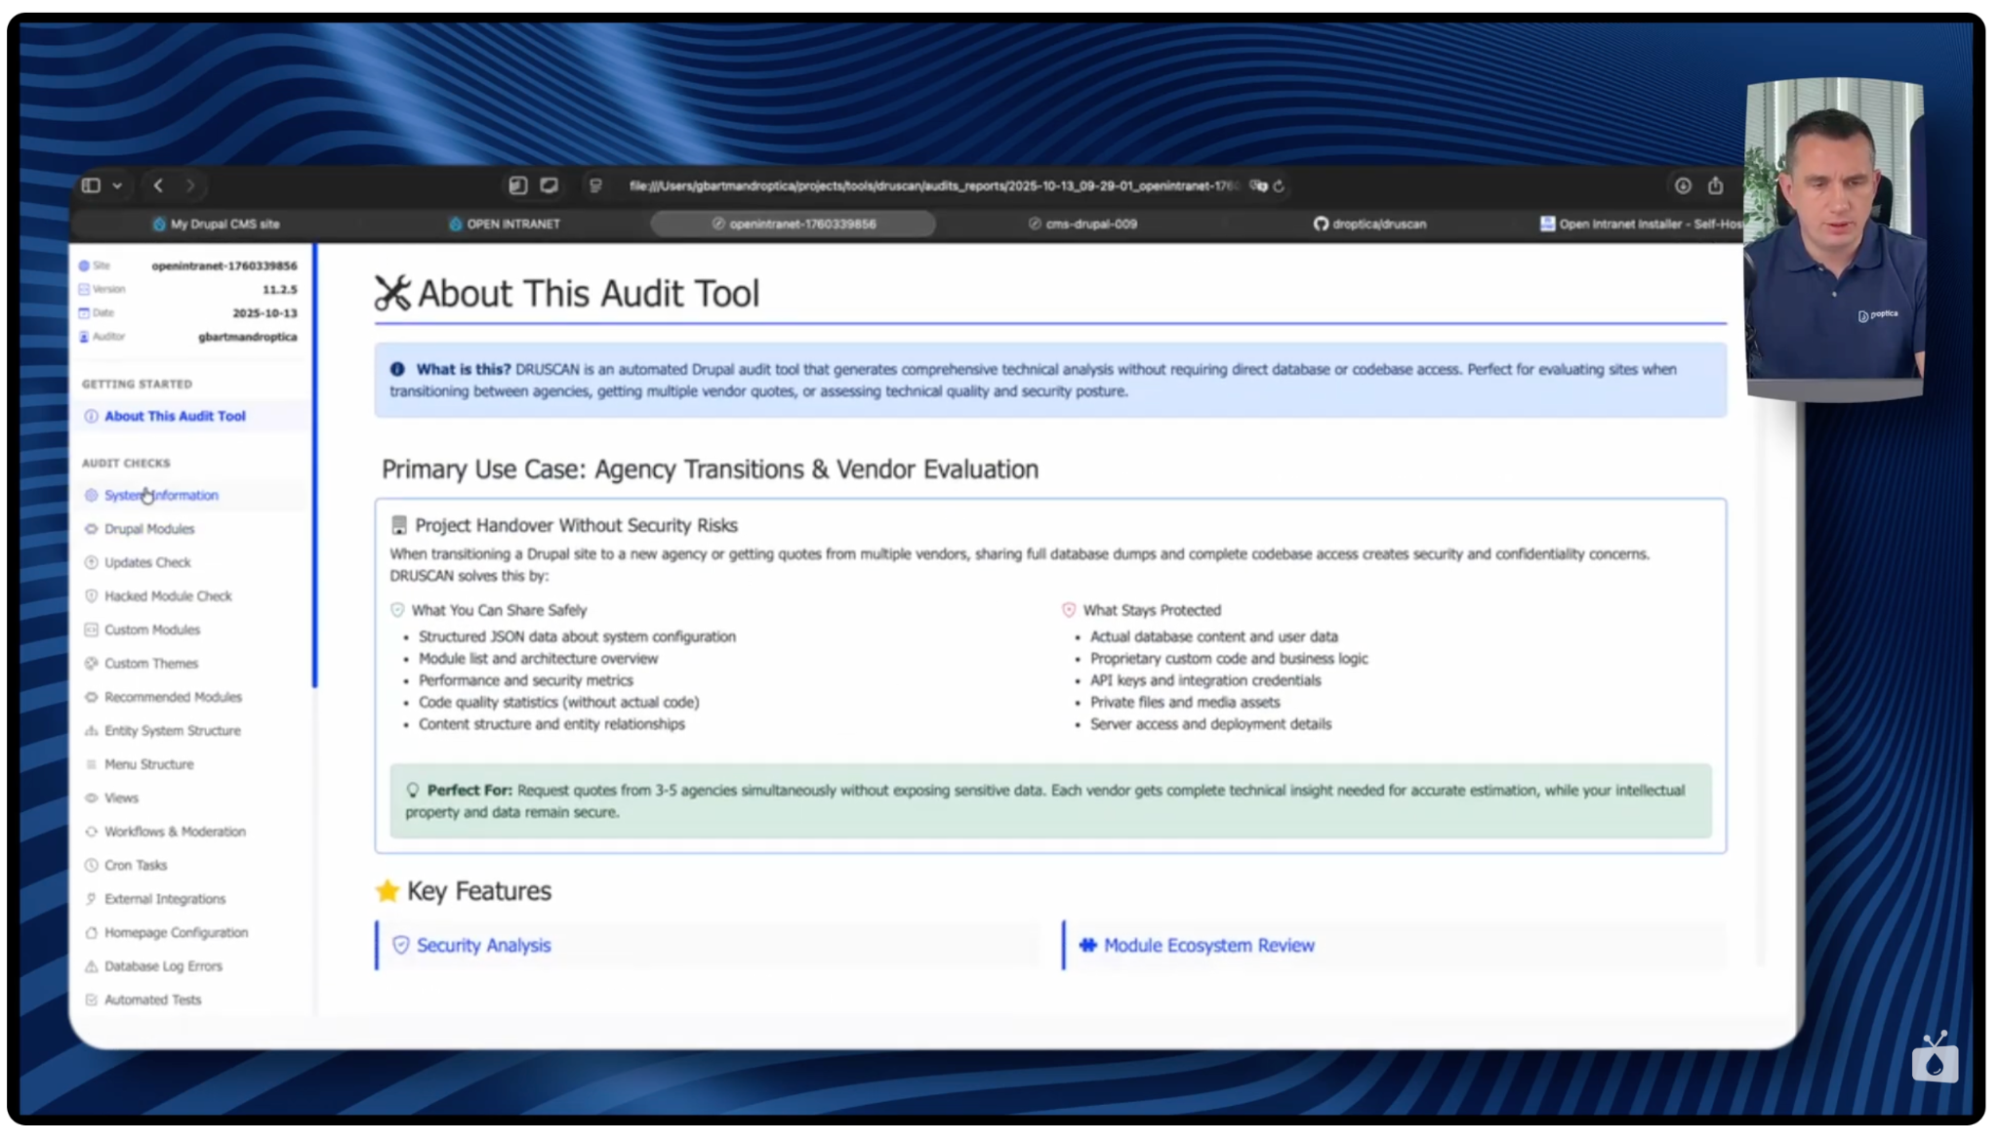
Report home page
The first page of the HTML report serves as an introduction. It contains a description of how the tool works, but doesn’t yet present data specific to the analyzed installation.
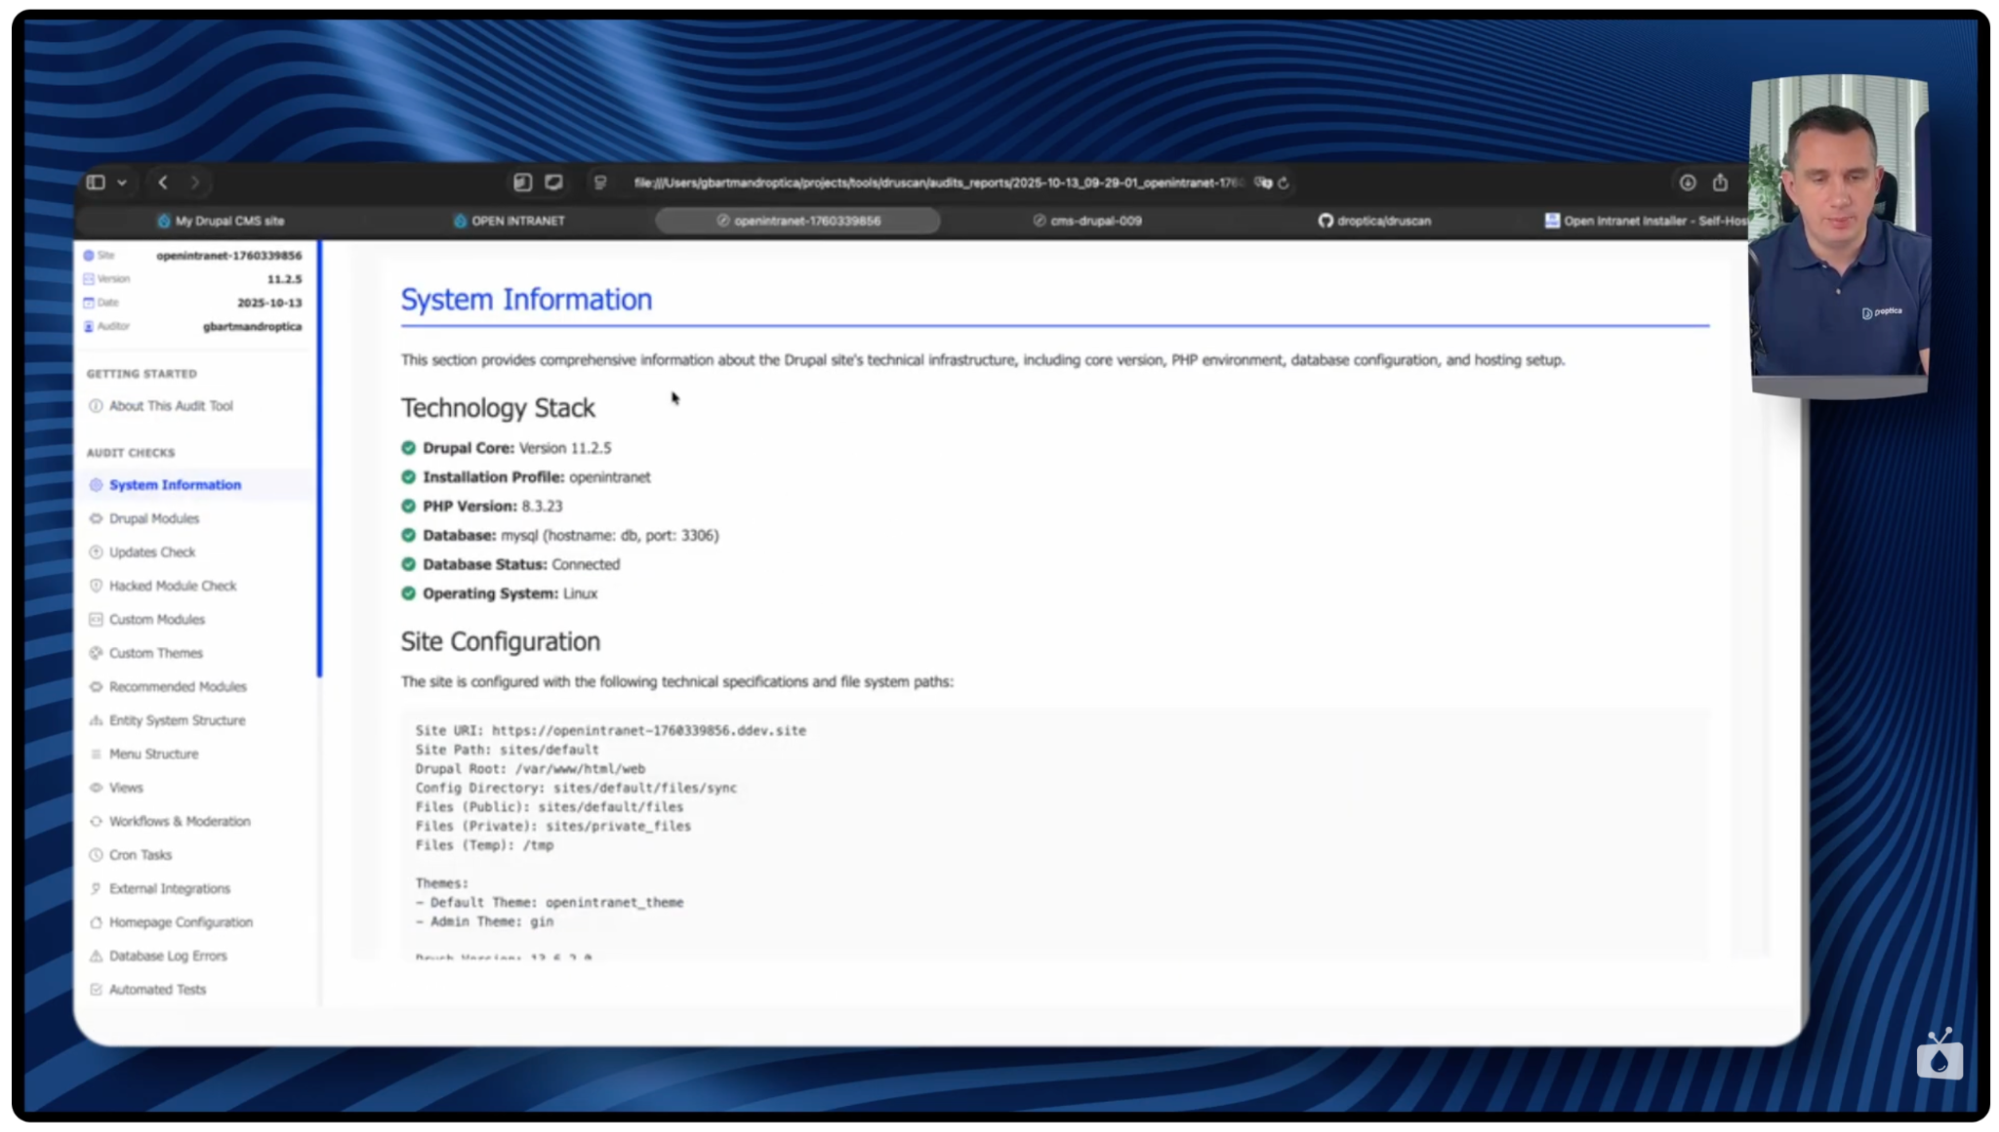
Information about the Drupal system
In this section, the report begins to present specific technical data about the Drupal system, including:
- the number of active modules,
- module versions and patches applied,
- a general overview of the system configuration.
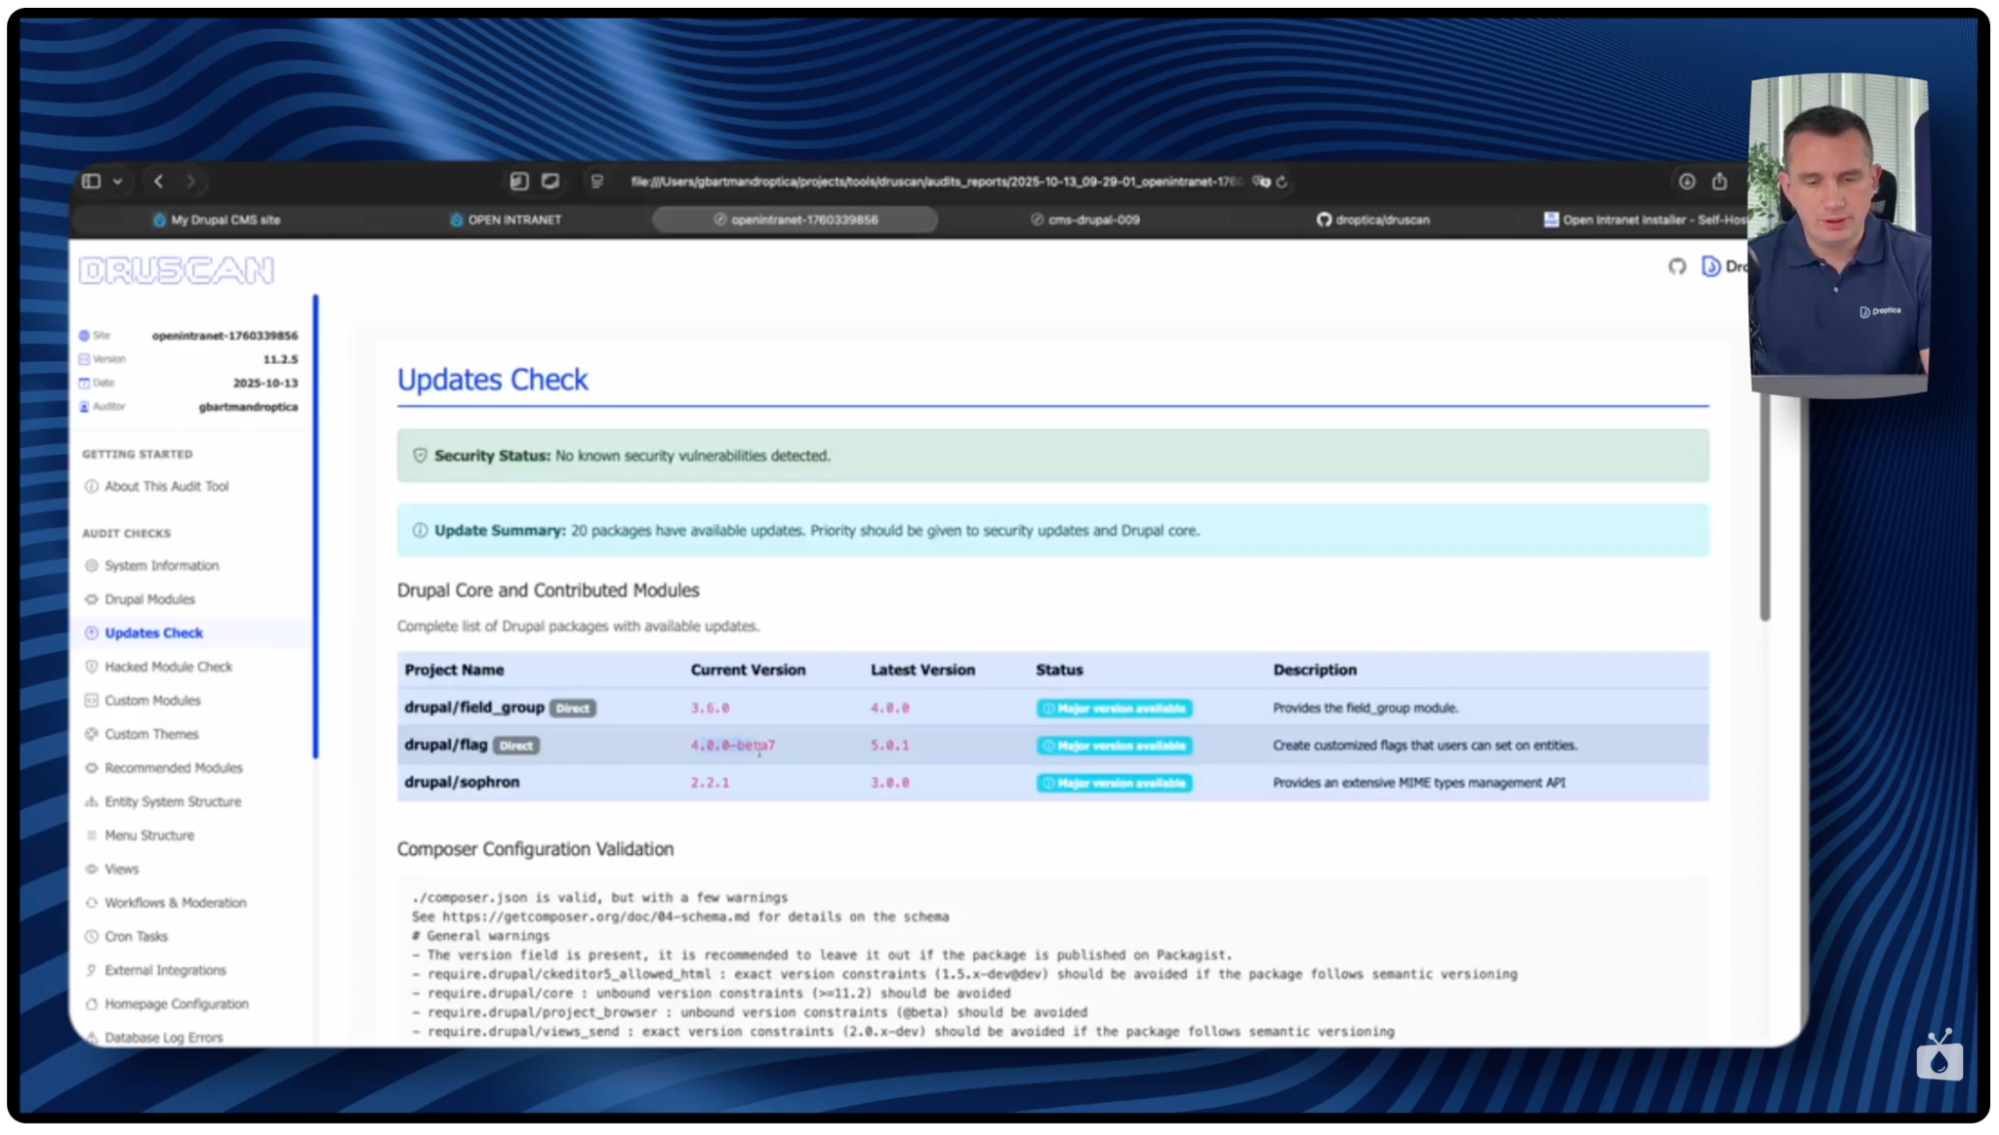
Available updates
The Updates Check section shows which modules have updates available, including:
- functional updates (e.g., Field Group 3.6 → 4.0),
- major version changes (e.g., Flag 4.0 → 5.0),
- any security updates, clearly marked in red.
If all modules are up to date in terms of security, a clear green message appears.
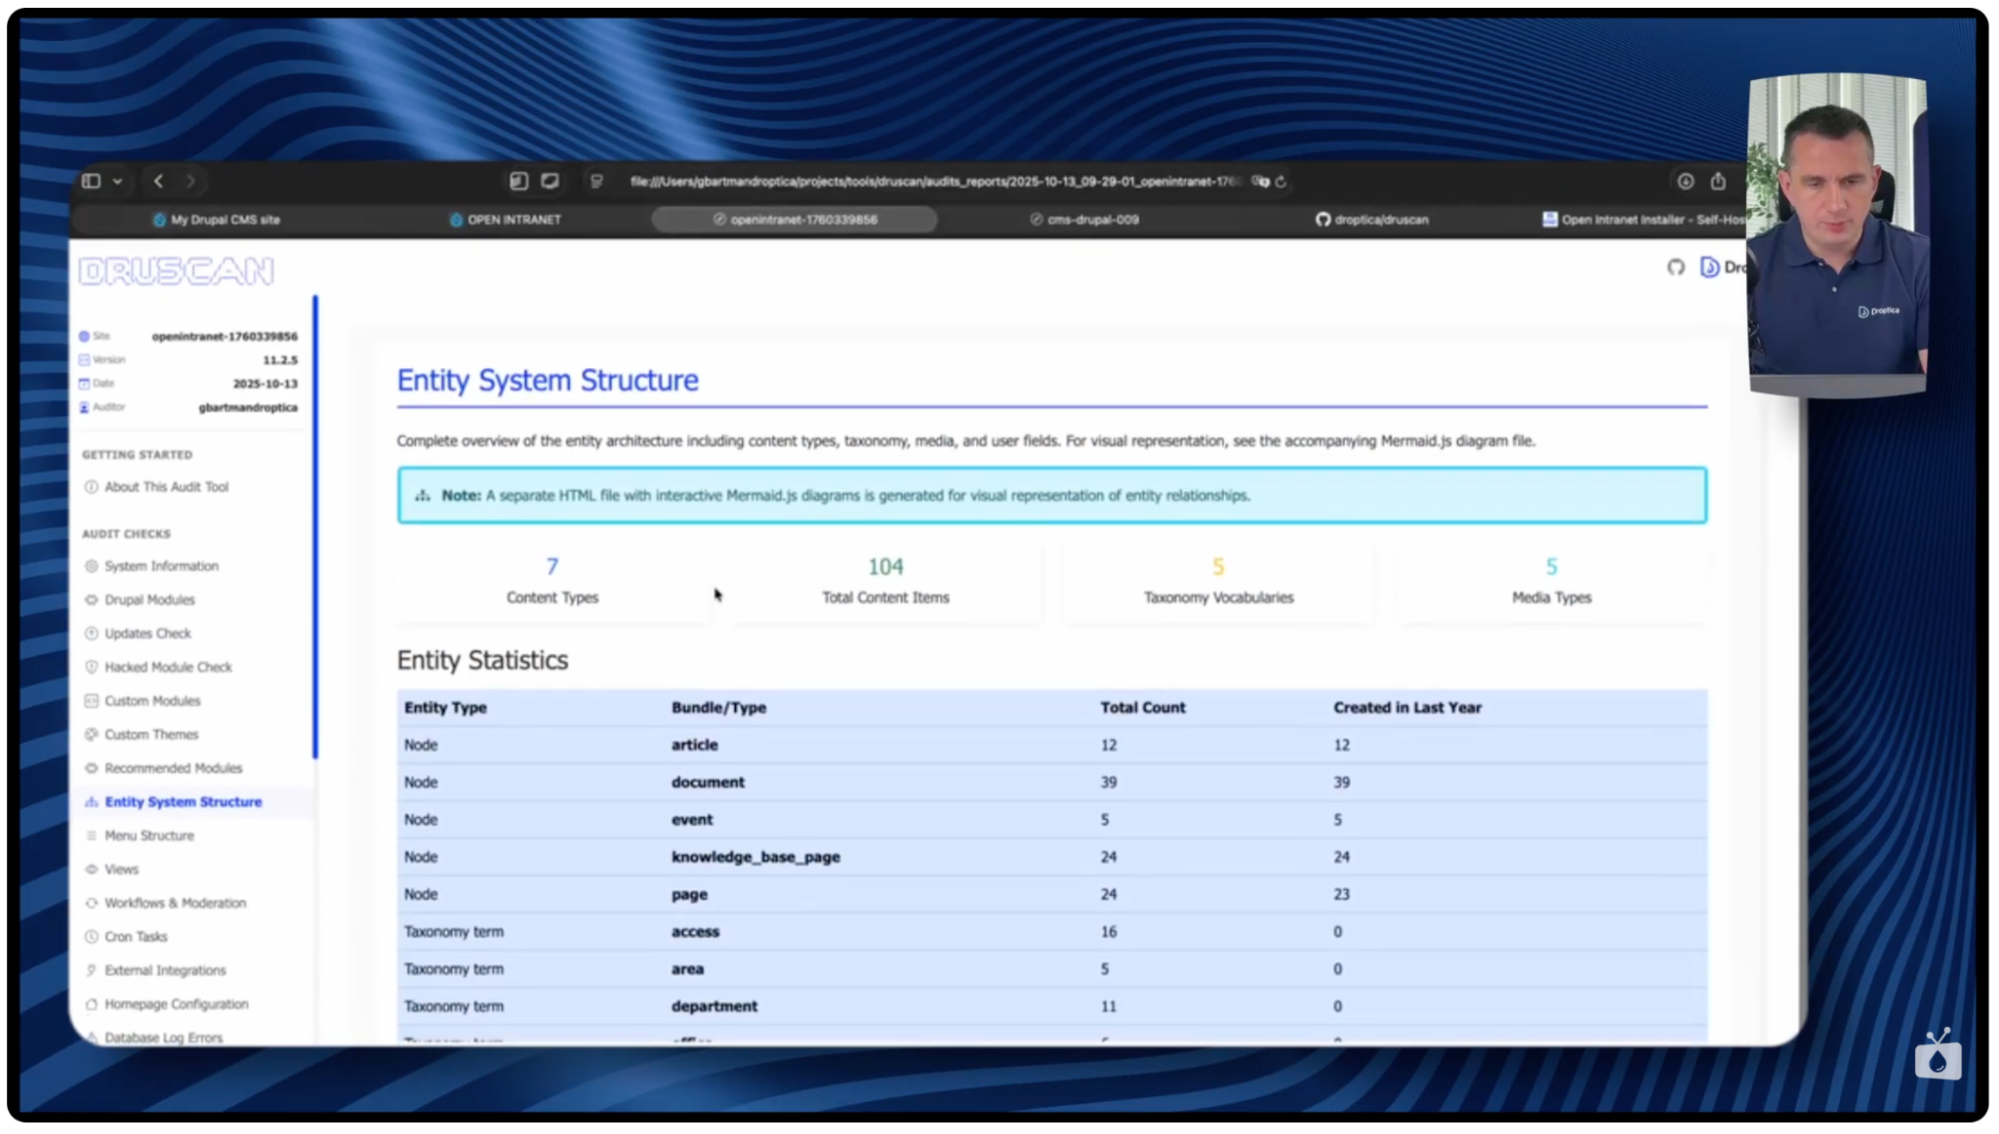
Data structure (Entity Structure)
In the Entity Structure section, Druscan presents detailed information about the types of content in the system: how many types exist and how many items have been created in each of them. For example, the report may show 12 articles and 39 documents, along with additional information about how many of them were added in the last year.
This metric is extremely useful because many projects contain content types that were once created for testing or single functions and are no longer used over time. If Druscan detects that no new items or edits have appeared in a given content type for many months, it can be considered inactive and omitted from further analysis of the system. This allows you to more quickly assess the actual content structure and organize items that are no longer needed.
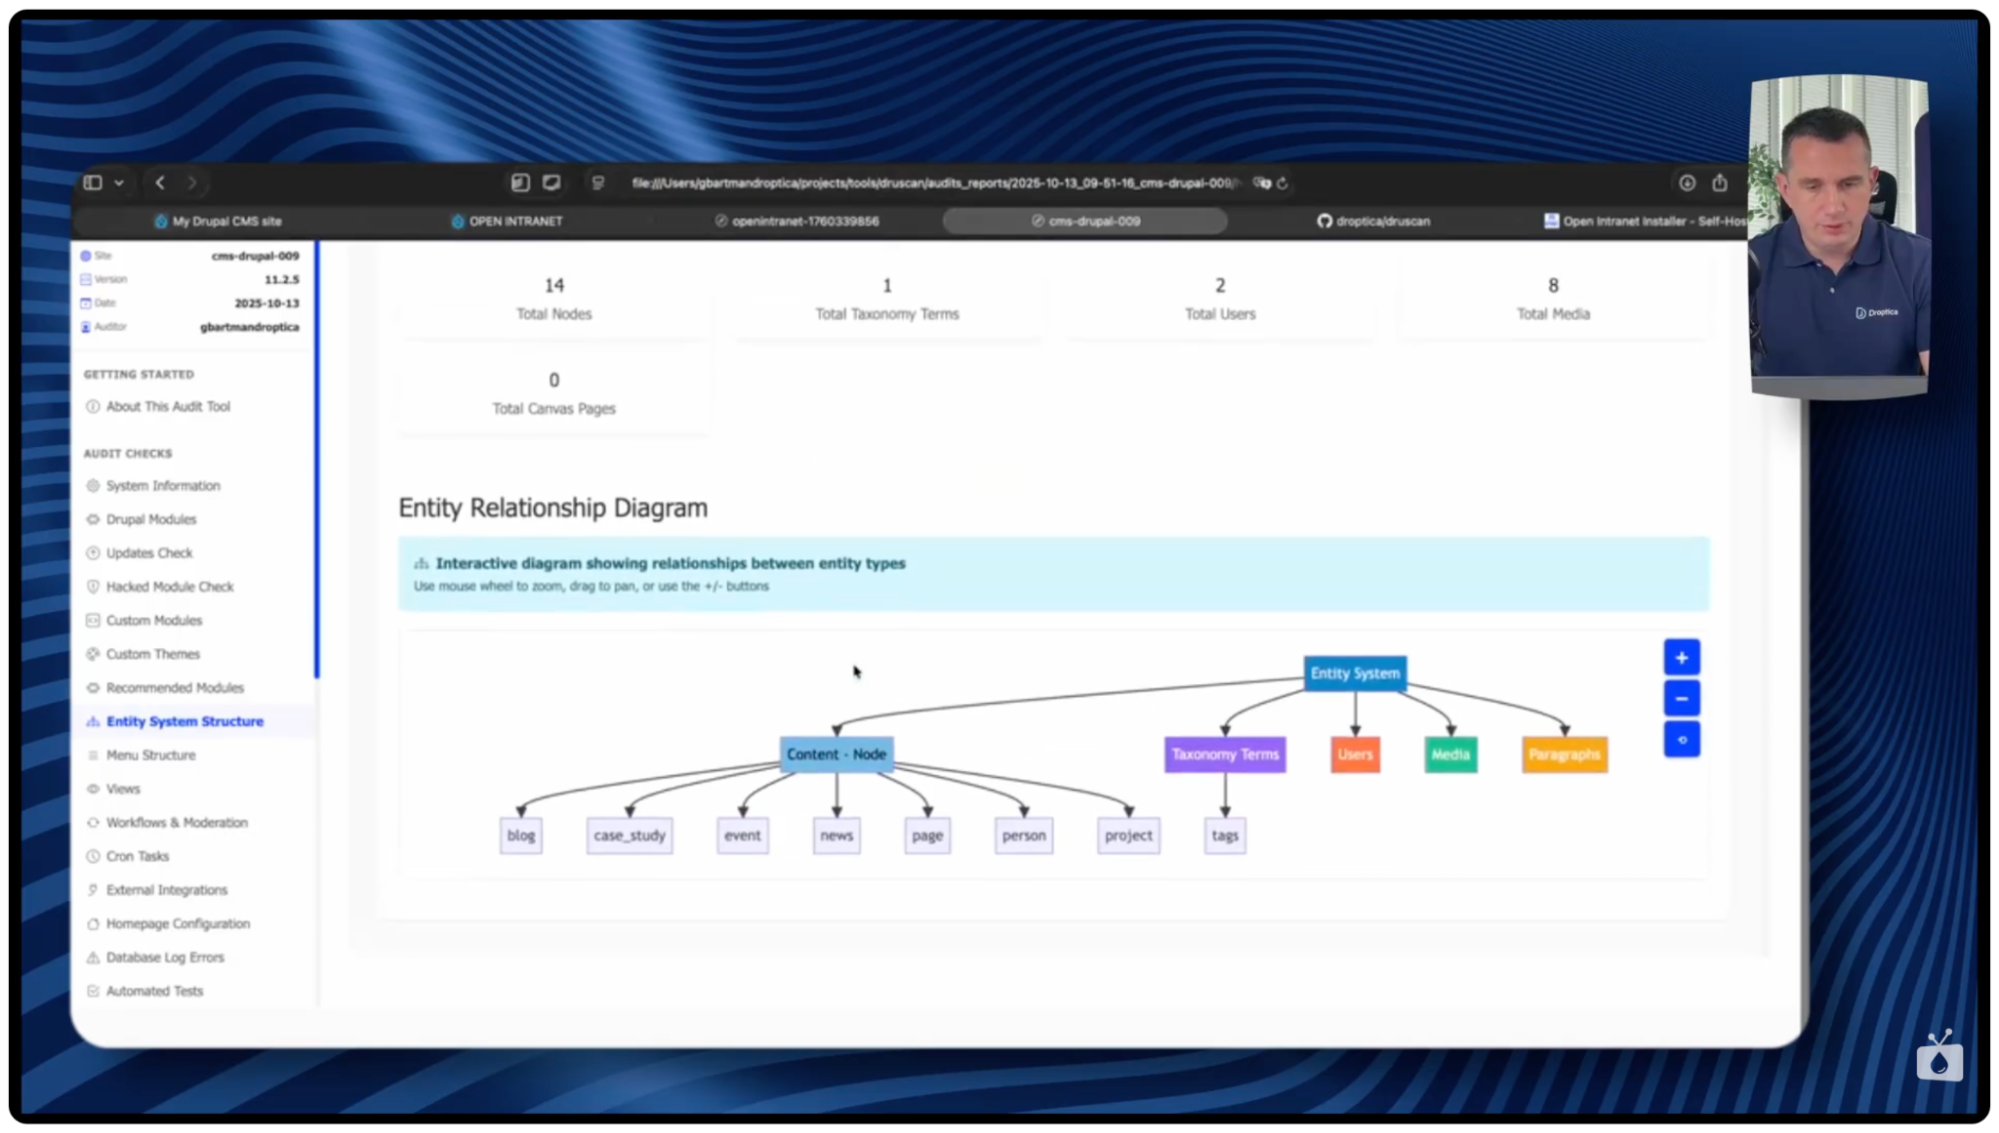
Automatic diagrams
The report generates interactive diagrams showing the structure of the system. They can be enlarged and moved. The most important ones include:
- the full hierarchy of the main menu,
- the structure of selected configuration elements.
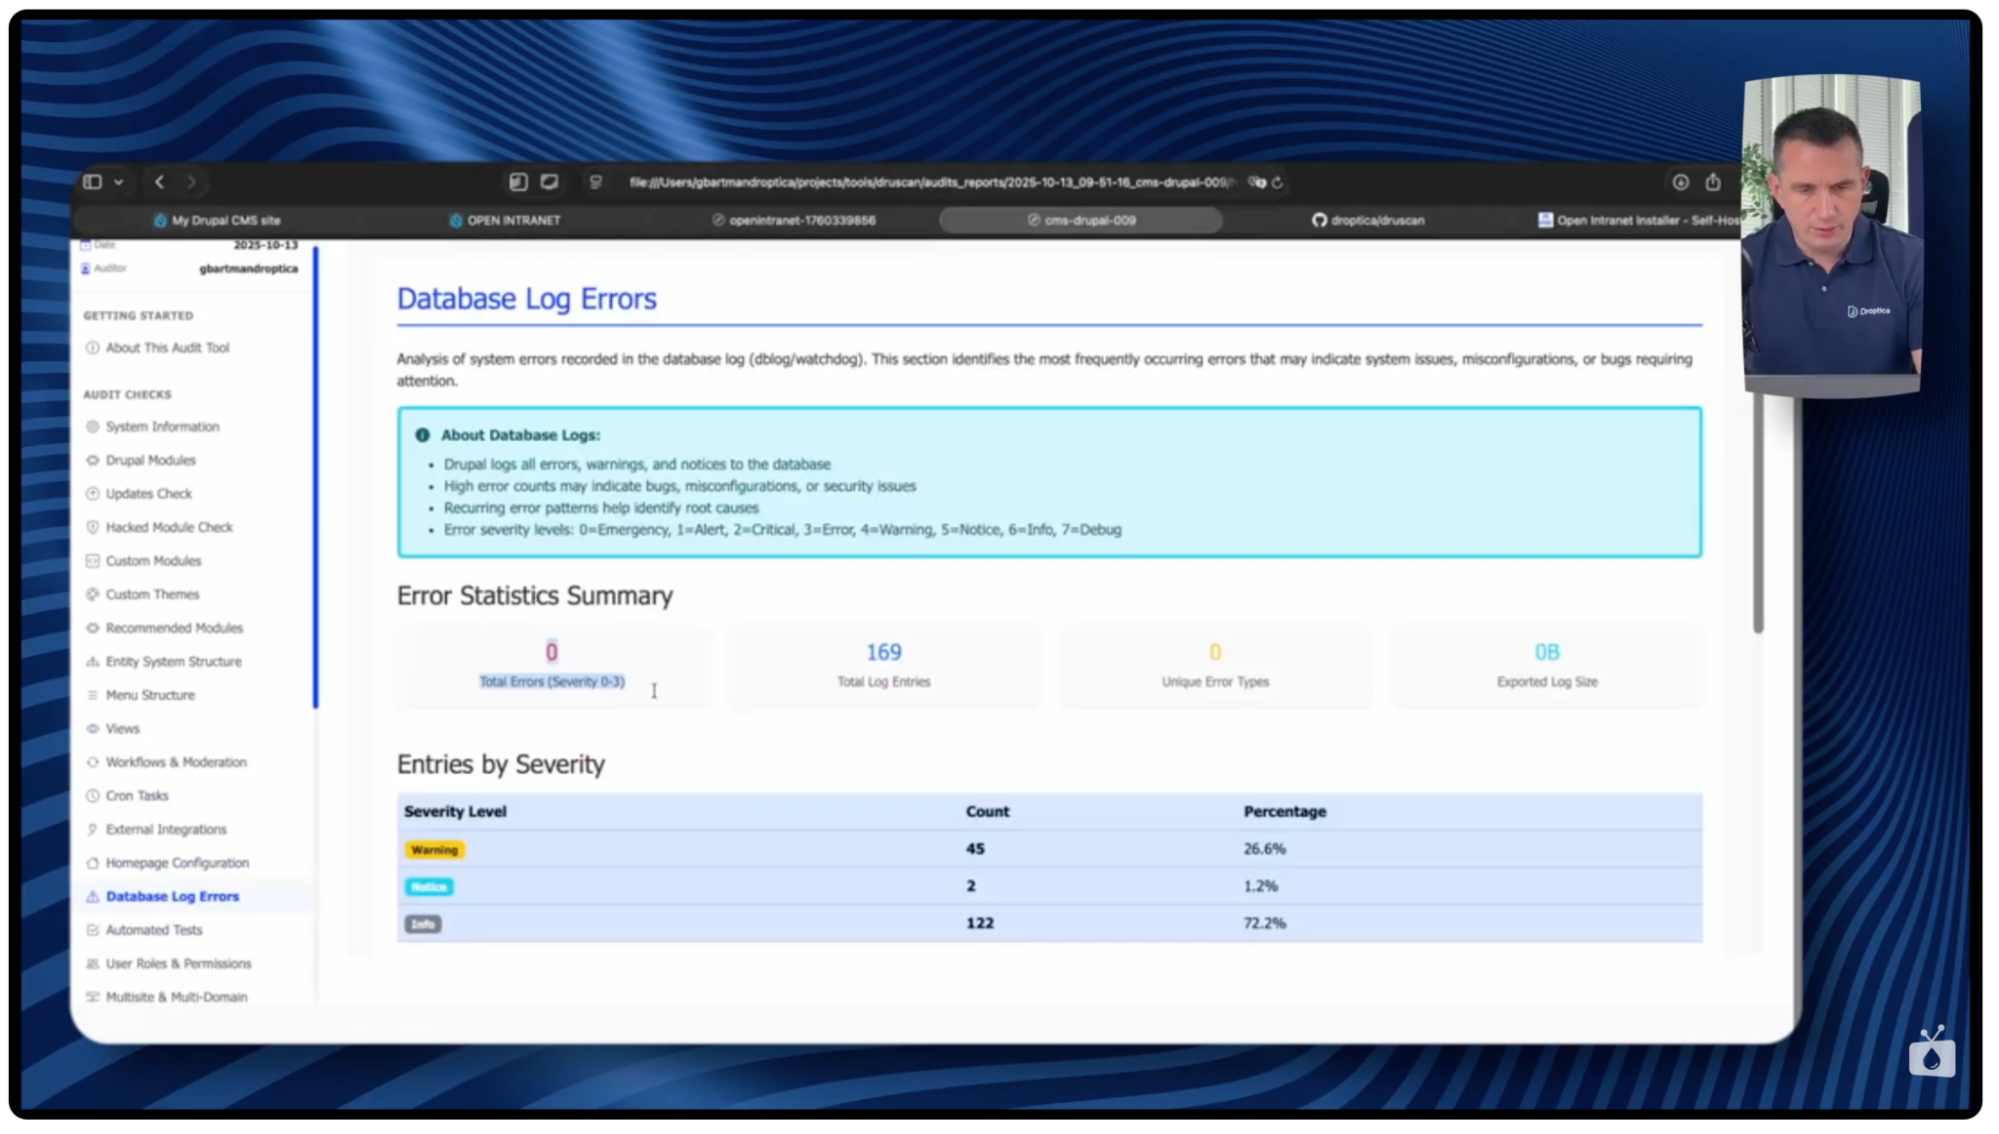
Database logs
In this section, you’ll find errors recorded in the dblog along with information about which modules they concern. This is a quick way to determine the stability of the system and potential issues that require attention.
AI section (optional)
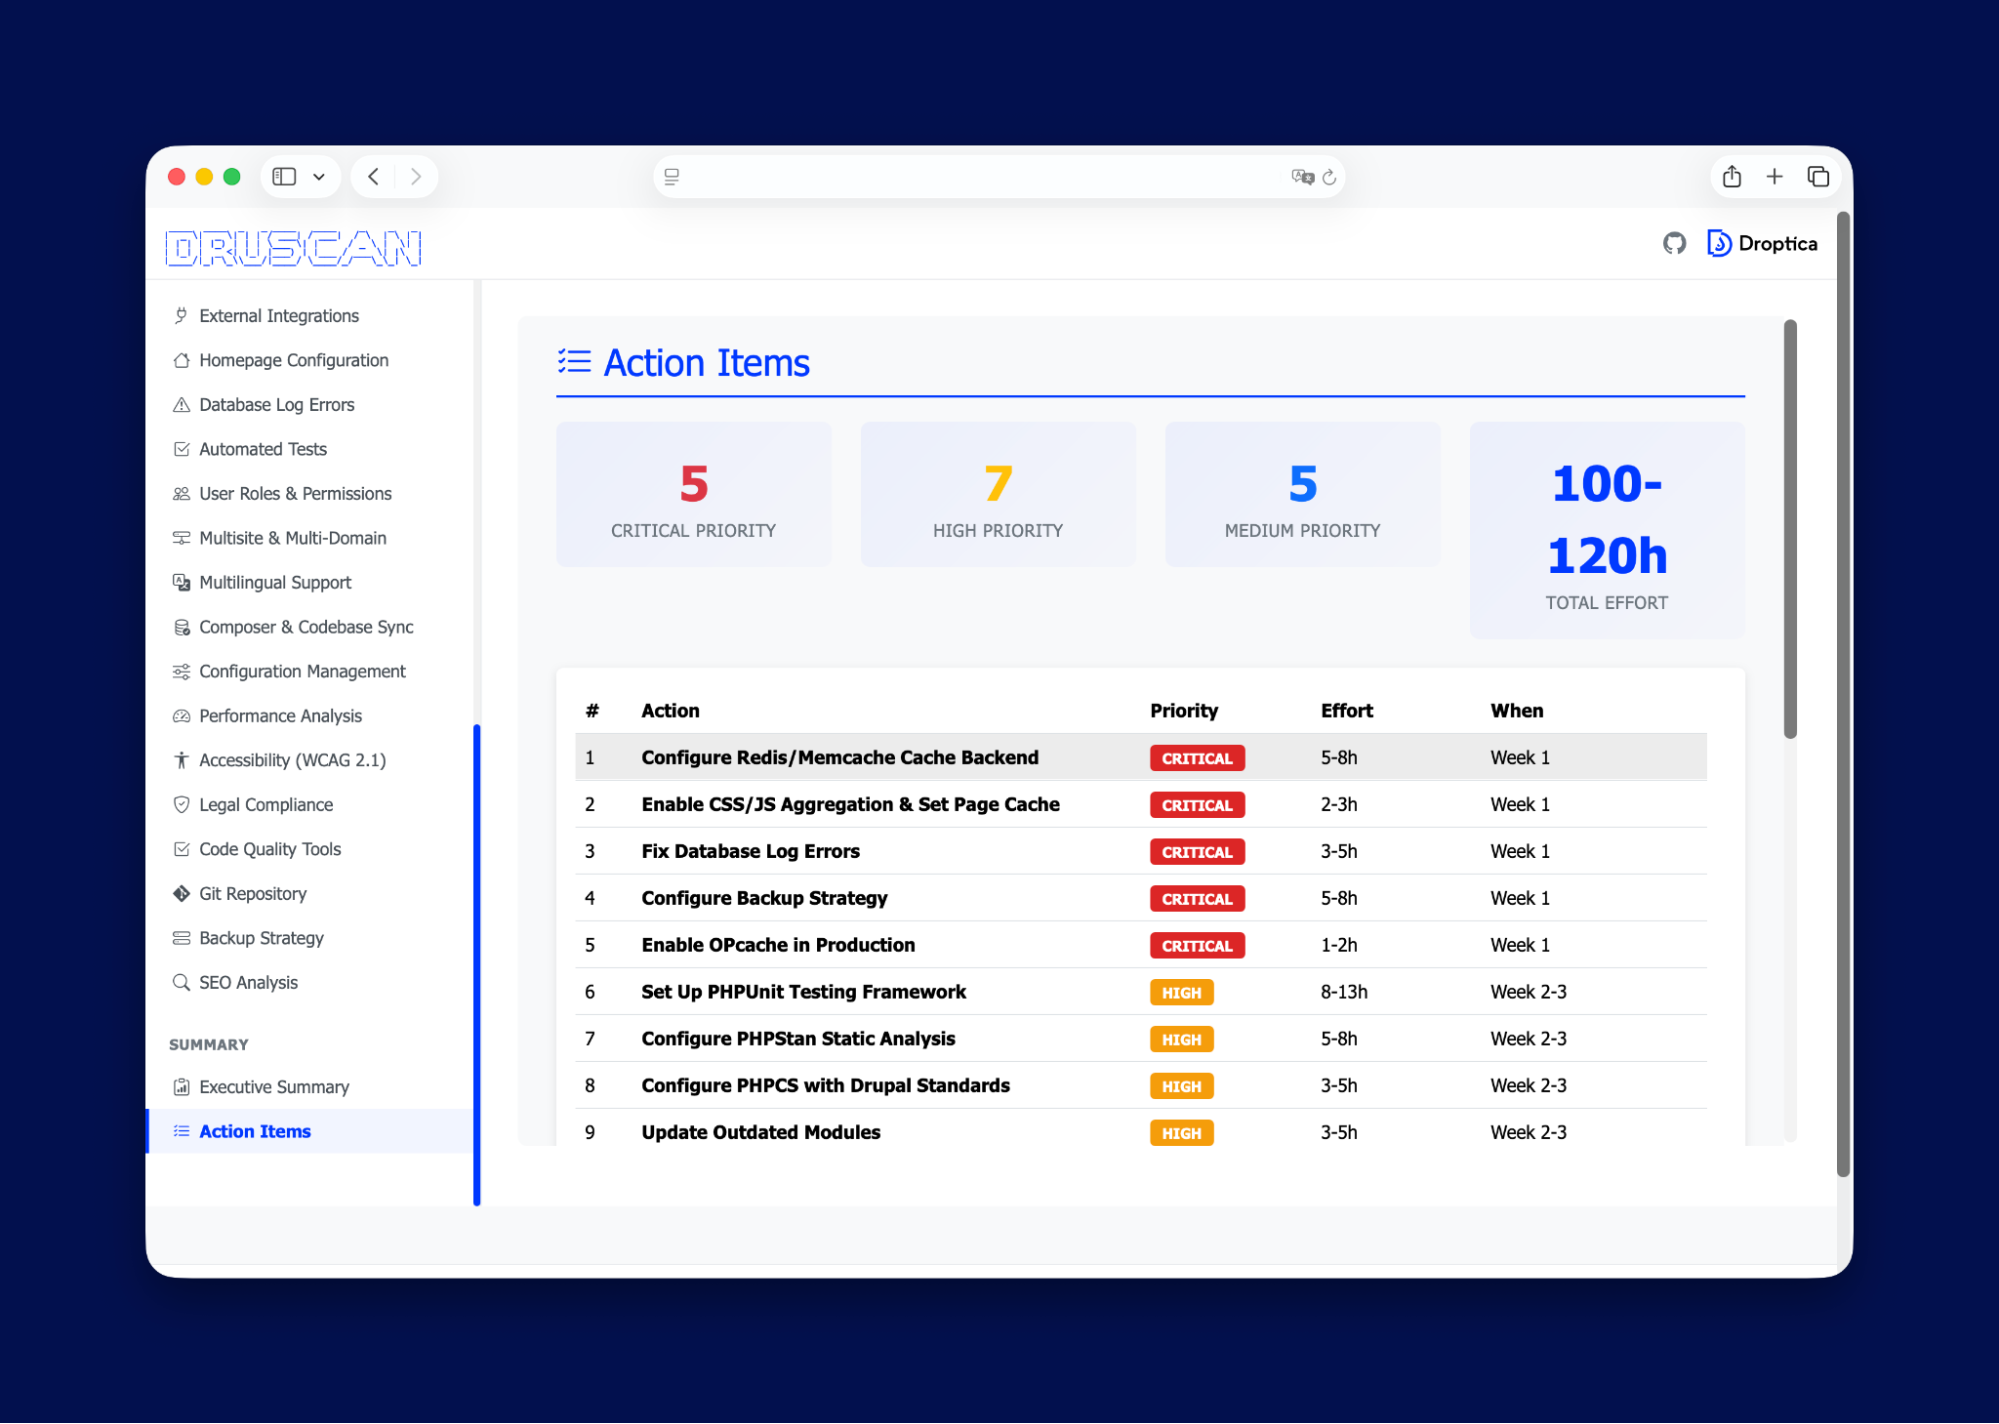
If the technical audit was run in AI mode, the report contains an additional section with recommendations. It includes:
- a list of the most important things to improve,
- recommendations for optimization,
- positive aspects of the installation,
- action items with priorities and time estimates.
As always with AI tools, it’s worth having the recommendations verified by an experienced Drupal specialist.
Demo: how a Druscan technical audit works on a real project
To show how Druscan works in practice, I’ve prepared an analysis of two locally launched installations: Drupal CMS version 1.2.5 and Open Intranet , which is Droptica's starter for building corporate intranets.
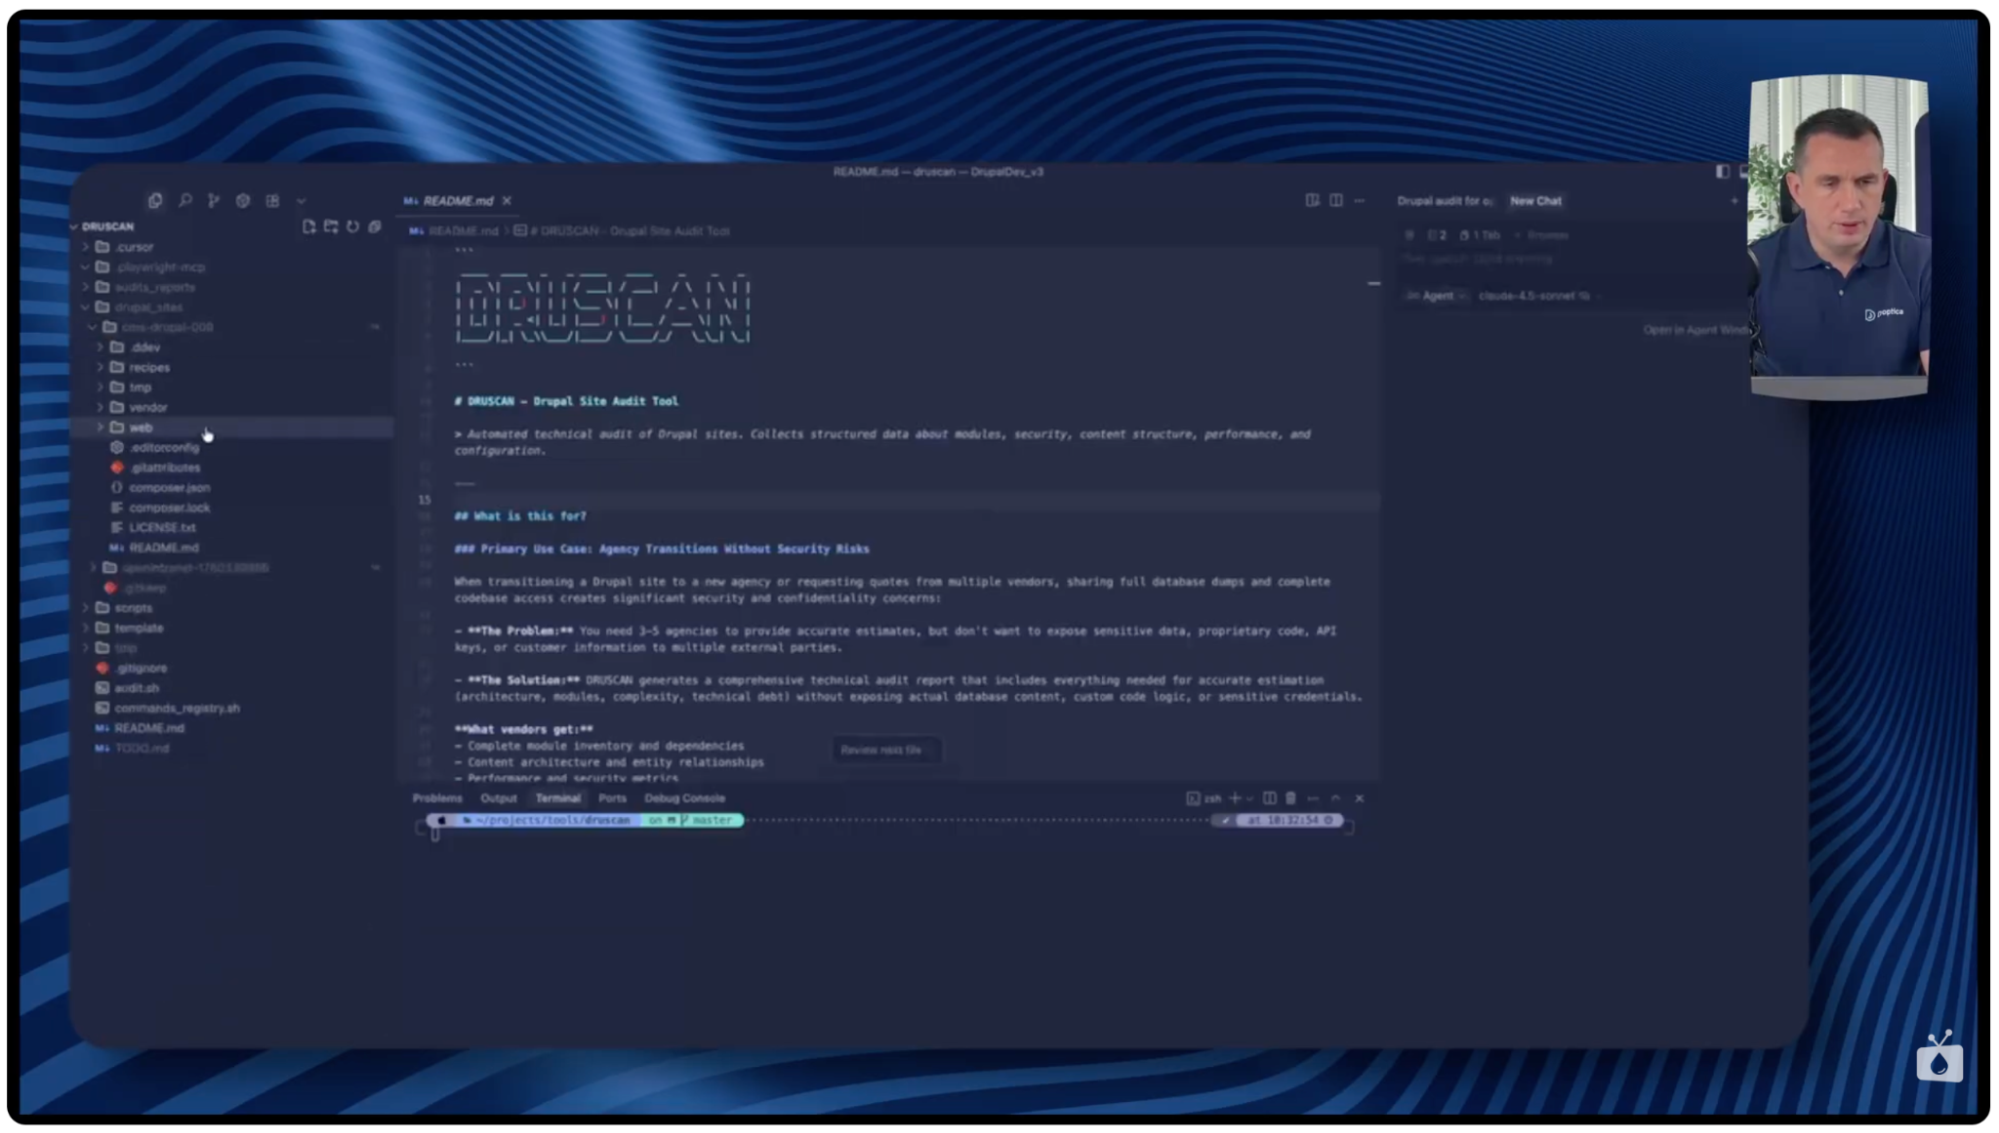
Druscan project structure
The Druscan repository on GitHub has a simple, clear structure. It contains:
- a scripts directory with files that perform individual audit steps,
- a template directory with report element templates,
- the main script that runs the entire process (audit.sh file),
- a list of checks, based on which the report is generated.
You can easily customize the tool to suit your needs, e.g., by adding new analysis elements or modifying existing ones.
Preparing the environment
To run the audit, Drupal installations are added as symlinks in the Drupal Sites directory. Each symlink points directly to the web directory of a given site.
In the example described, there are two projects:
- cms-drupal
- open-intranet
This allows Druscan to "see" multiple installations simultaneously and analyze them independently.
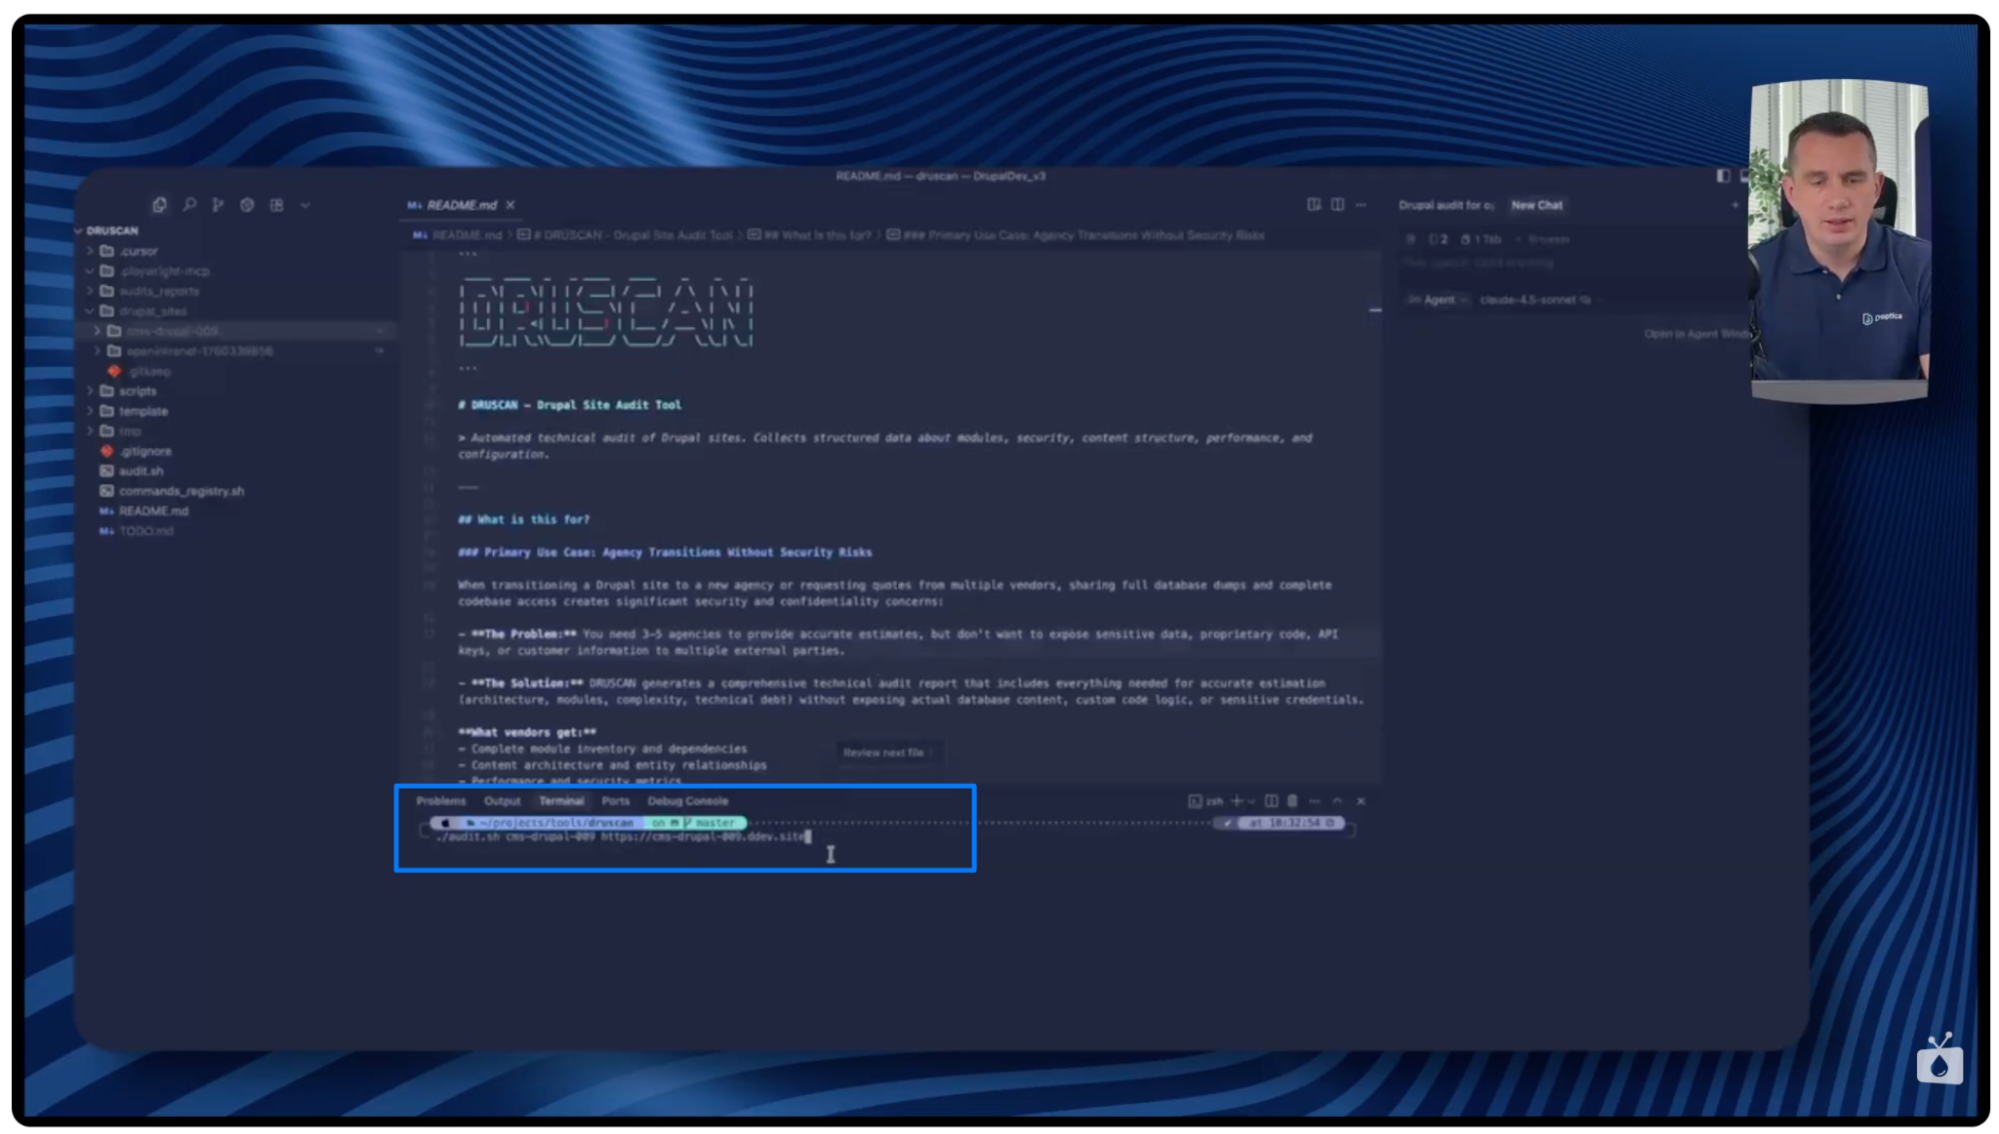
Running an audit in basic mode
Scanning begins by calling the script:
audit.sh <directory_name> <URL_address>
After startup, a new folder with the date is created in the Audit Reports directory, where JSON files containing subsequent data gradually appear:
- first, information about the database and Drupal version (drush status result),
- then a complete list of modules,
- later available updates,
- and then other configuration and metric items.
The file with modules is usually the largest, as it contains detailed information about each of them.
The Cursor isn’t required for this mode. The script can be run locally.
Running in Cursor mode with AI
The second mode uses the Cursor tool, in which you define the command that triggers the audit and the prompt describing the analysis method. After entering a slash (/) and selecting the prepared Cursor command:
- Runs the standard Druscan script.
- Waits for JSON files to be generated.
- Analyzes them using AI.
- Generates a summary and recommendations.
In the case of the Open Intranet installation, the entire process took about 17 minutes, after which a complete analysis with a list of improvements was generated.
Results of technical audits
Below are sample results of audits performed using Druscan for two different Drupal installations.
For the Open Intranet system
The report for Open Intranet showed:
- 149 active modules, along with versions and patches,
available updates, e.g., Field Group (3.6 → 4.0) and Flag (4.0 → 5.0), - no security updates (green message in the report).
The Entity Structure section showed:
- 12 articles,
- 39 documents,
- information on how many of them were created in the last year – which helps to assess which types of content are actually used.
The report also generated clear diagrams, including a full main menu that can be enlarged and moved. Seventeen errors were found in the logs, including one related to the EDSA module, which requires further diagnosis.

For the Drupal CMS
The second report – for Drupal CMS – was generated in basic mode, without AI analysis.
Key information:
- EDSA module update available (2 → 3),
- the system uses 110 modules,
- no custom modules,
- content types: blog, case study, event, news, along with the number of items,
- 19 active views,
- 0 errors in the dblog, which proves the stability of the installation.
The Lighthouse test for this installation showed a score of 100/100, confirming high performance optimization. The report only indicated minor issues related to WCAG.

What are some other uses for Druscan?
Although I mentioned at the beginning of the article that Druscan is very helpful in preparing quotes or changing agencies, its range of applications is much broader. The tool works well in many everyday scenarios when working with Drupal.
Onboarding new team members
Druscan allows you to quickly understand the structure of the system when a new developer joins the project. Instead of reviewing the code from scratch, they receive a single comprehensive report containing information about modules, content types, configuration, and architecture. Such a report also works well when a project is transferred between teams. It facilitates knowledge transfer and shortens implementation time.
Regular technical audits
Our technical audit tool can be used regularly, e.g., every six months, to monitor changes in the system. Comparing successive reports allows you to quickly notice:
- new or deleted modules,
- growing technical debt,
- emerging errors,
- changes in content structure or configuration.
This is a practical way to track the evolution of a project and identify areas that require attention.
Technical documentation support
Technical documentation often becomes outdated, especially in rapidly developing projects. Druscan solves this problem by generating an always up-to-date, automatic snapshot of the system architecture.
Although it doesn’t replace the full website documentation, it’s an excellent supplement, especially when you need:
- a list of used modules,
- configuration review,
- data structure and content types.
Automatically generated reports always reflect the actual state of the system.
Technical debt assessment
The Druscan report helps you easily determine the level of technical debt in your project. It shows, among other things:
- the number of modules requiring updates,
- outdated components,
- errors occurring in logs.
This allows for better planning of the budget and maintenance schedule.
Verification of the agency's work quality
Druscan can also be helpful when you want to assess the quality of the agency working on your website. The report allows you to check whether:
- the system is regularly updated,
- the number of errors in the logs is increasing,
- the structure of the system remains consistent and logical.
This is an objective picture of the technical condition of the project. The audit report is particularly valuable before renewing a contract, changing a supplier, or starting a larger scope of work.
Drupal technical audit with Druscan – summary
Druscan is useful not only in the process of changing agencies. It’s a universal tool for technical auditing and creating documentation for Drupal projects. It allows you to solve a fundamental problem in the industry – how to share information about a website or system without the risk of sensitive data leaks.
The tool is available with clear installation instructions. If you have any questions, you can ask them under the video on the “Nowoczesny Drupal” channel or report bugs, and suggest improvements or new features directly at GitHub .
For more information about our tool, sample sections from the report, and a download link, visit the Druscan website.