
What is Web Analytics and What are Its Tools?

A company website can become effective advertising and sales tool. In order to make the most of its potential, it is worth using web analytics. It will help you understand your customers better, and in addition, it will help you identify the weaknesses of your website and your advertising campaigns. Find out what web analytics is and what tools you can use to collect valuable data.
What is web analytics and why is it important?
Web analytics is the process of collecting and reporting data from websites. Special tools are used for this purpose. The generated reports on what is happening on a given website, as a result of organic interest in the brand and in connection with conducted advertising campaigns, are then analyzed by specialists of a given company to assess the effectiveness of the website.
In a world where more and more companies are basing their business decisions on data, creating an online strategy based on intuition alone may not be enough. Websites serve a variety of functions. Whether you’re using your website as a sales or marketing tool, or just as a business showcase, it’s worth considering how to optimize it. The right analytics tools can help you assess whether your website is actually meeting its objectives and provide you with the information you need to improve it. Moreover, they can help you refine your strategy. This is because web analytics allows you to better understand the potential and current customers of your company. It’s worth choosing the right tool before launching your website to measure its effectiveness right from the start.
What can be measured by web analytics tools?
Each analytics tool for monitoring website traffic is different. However, there are a few standard measures of your website's performance that should appear in each of these applications, even if they will have different names.
The data that analytics tools can provide you with are quite diverse and complementary. They can be divided into quantitative and qualitative types.
Quantitative data are numbers and percentages. A good example of quantitative information is the number of customers, the effectiveness of marketing activities (conversions), and activities on the website showing user behavior within the website (e.g. expressed as a percentage). Such information makes it possible to identify a problem, e.g. too few conversions, too high a bounce rate, too many abandonments of the shopping cart. However, it’s difficult to identify the exact problem on the basis of such information.
Qualitative data will enable you to pinpoint the problem because they tell you what is causing the given behavior This type of data is obtained, among other methods, by conducting surveys in which detailed questions can be asked to customers (e.g., why they abandon the shopping cart, whether they found what they were looking for on the website, etc.).
Web analytics tools present, among others:
- Page views — how many viewers came to your website in a given time period. This is very important information as it allows you to assess the visibility of your website, the effectiveness of your advertising campaigns, and the interest in your content and brand.
- Number of new sessions — a session, unlike a view, isn’t a single event, but a sequence of user interactions with your website (multiple views, transactions made, etc.) over a defined period of time. With this metric, you know what proportion of your website views are made by new customers and what proportion are made by returning customers.
- Session details — e.g. high bounce rate or average session duration. A short time spent on the website and a high bounce rate may suggest that, despite effective advertising, your website content isn’t matching customers' needs. You can also gain information on the most frequently visited websites (i.e. you find out what content is most popular).
- Sources of traffic — from which sources do viewers come to your website (from social media, as a result of a search, from other portals, from advertising, etc.).
- Devices — individual tools are able to indicate which devices are used by viewers to view your website. It’s worth paying attention to this information, especially if you’re considering creating a mobile version of your website or improving responsiveness.
- Conversions — the conversion rate tells you what percentage of visitors of your website perform desired actions. This allows you to estimate what your current customer acquisition costs are and whether your campaigns are effective.
Based on additional metrics (e.g. demographics such as age and gender, preferences or interests), you can filter basic metrics such as page views.
Benefits of analysing website traffic and activity
Investing in the appropriate application can significantly improve your business operations. Using a proven web analytics tool will allow you to:
- Save time. High-quality tools analyze a wide variety of data. They are equipped with user-friendly panels for visualizing data in the form of graphs, charts, and diagrams, so you can quickly interpret the collected information. With just one click, you can generate detailed reports in one of the formats of your choice, instead of wasting your time manually creating them in, for example, Excel.
- Reduce costs — detailed analyses provide marketing professionals with useful data for planning more effective advertising campaigns, enabling them to increase the effectiveness of their activities while reducing advertising expenditure. By leveraging tools such as Google Analytics, businesses can track and optimize their web performance effectively. However, integrating Power BI, a powerful data visualization tool, can significantly enhance the understanding of this analytics data. With its ability to create impactful reports and dashboards from scratch, Power BI allows users to visualize complex data in an intuitive way.
- Improve the customer experience — having access to specific data about your customers' path on your website helps you to identify more quickly the problems they encountered along their path (e.g. difficulty completing a transaction or frequently landing on a 404 error page). You can then take additional action (e.g. making the purchase process easier or refining the navigation on the website) to change the customer experience for the better.
- Recognize various functional issues — certain information (e.g. low traffic) that a good analytics tool can provide you with may indicate low search engine visibility of your website (it’s then also worth looking at technical SEO issues), and a short session duration may suggest not very effective navigation on the website.
Analytics tools allow you to create reports from historical data. They allow you to compare traffic on your website over months and years, and see how your customer base has changed as well as the effectiveness of your campaigns. This gives you a better understanding of changes in the market and in your business.
Web analytics tools
Many tools for brand monitoring, marketing automation, or determining a website's SEO potential partly analyze the same data as website traffic analysis applications. In our overview, however, we focus on those designed to collect and process data related to user activity on websites.
1. Crazy Egg
Crazy Egg is a paid tool with a 30-day trial period that allows you to observe how customers navigate specific websites and where they click. This information allows you to understand how visitors interact with your content. Analysis of traffic sources shows you what your most successful campaigns are and from which sources users are most likely to navigate to your website.
Using this tool, you’ll find out why users leave your website (where they may have encountered a problem). Crazy Egg shows which errors visitors have experienced and when and presents the path of these customers until they encounter an error. The tool tracks visitors, creates popularity maps for subpages and monitors user sessions. It also allows to carry out the A/B tests to optimize the website more effectively.
Reports in Crazy Egg are easy for any user to understand as they use visualizations. The tool can be integrated with popular platforms such as Shopify or WordPress. In addition, the number of users you can add to the team is unlimited.
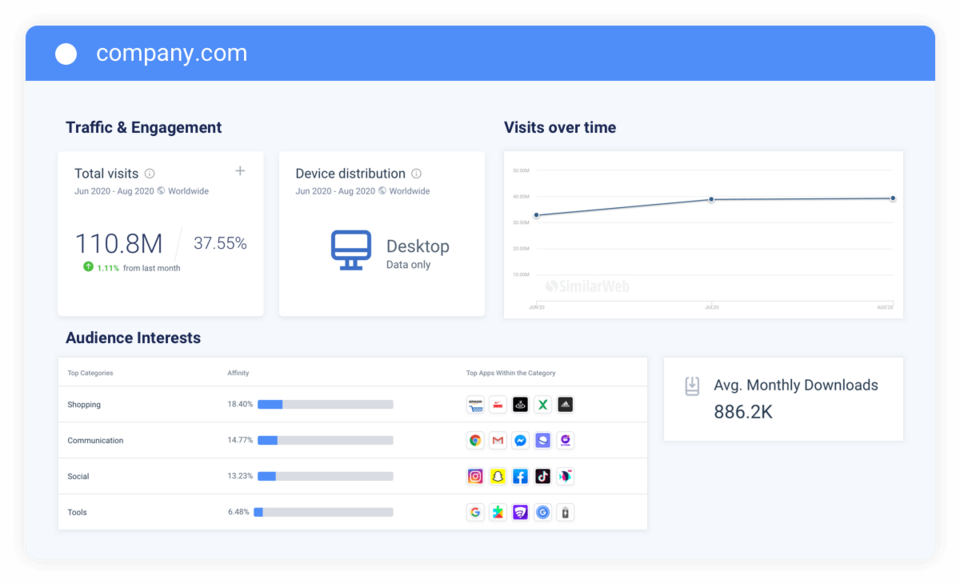
2. SimilarWeb
SimilarWeb is a brand offering a paid Research Intelligence tool for a comprehensive analysis of your website's competitiveness with a free trial period. It’s used to analyze website traffic and provides the user with information about the number of visits to a given website and the number of subpages viewed during a single visit.
Using this application, you’ll find out what the sources of visits to your website are and where users navigate after they leave the website. This tool allows you to get to know your website's visitors better. Among other information, you can find out on which devices your website is displayed and obtain data on the age, location, and interests of your visitors.
With SimilarWeb, you can check the loyalty of users towards other brands, to find out in which group it’s beneficial to attract new customers for your business. This solution has also additional tools to analyze your competitors and compare your website with them.
3. Matomo
Matomo is a tool that is available for free if you choose to host it on your own servers or in a paid version available in the cloud. Its big advantage is that linking a website to the tool doesn’t require any programming skills or advanced knowledge of creating websites. This can easily be done using popular CMS.
The solution has plenty of business-useful features, such as the ability to carry out SEO analysis of your website or a tool for evaluating the forms you place on your website. It also allows you to perform A/B testing, as well as analyze the effectiveness of video or audio elements placed on your website. You can switch to using Matomo without any worries, even if your company previously used Google Analytics, as the application allows you to easily import historical data.
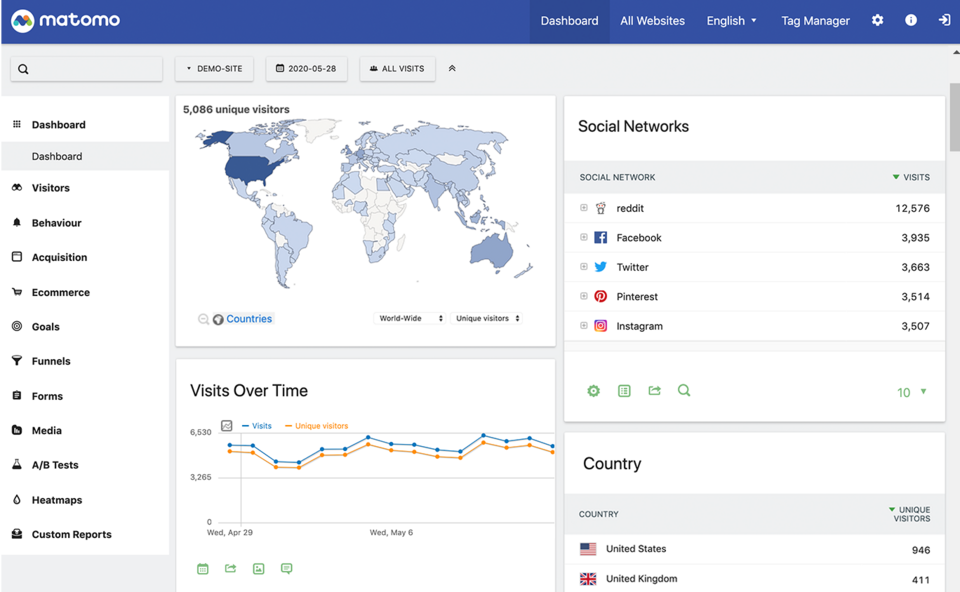
Matomo provides detailed information about your users, the sources from which they navigate to your website, their behavior on the website (including purchase behavior), and conversions. The user has access to heatmaps - visualizations showing where the visitor clicked and how they navigated through the website. Sessions are recorded so that, when you analyze the reports, you can replay a potential customer's navigation through the website.
Reports can be customized to suit the individual company's needs. There are more than 200 values and metrics for the user to choose from, which they can include or exclude from their visualizations. The same goes for the user interface. You can shape it according to your own preferences.
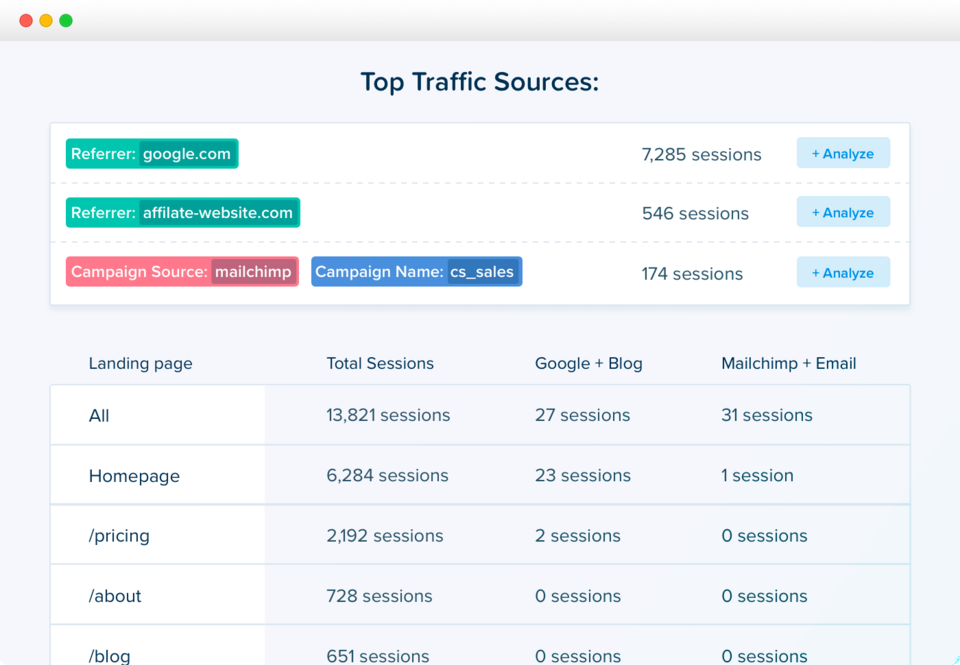
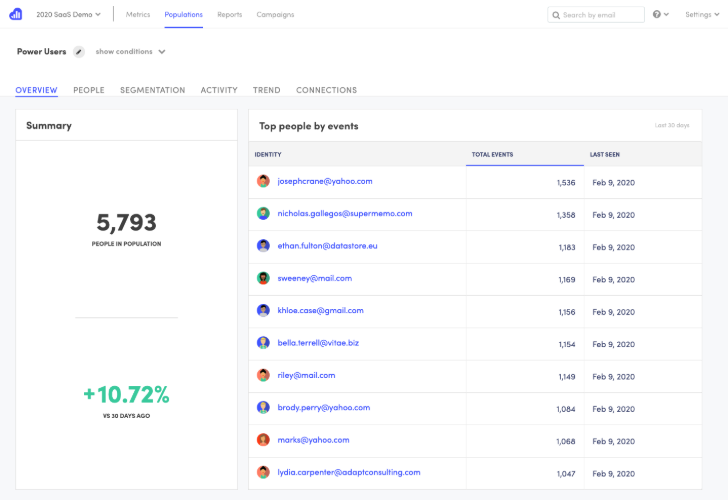
4. Kissmetrics
Kissmetrics is a paid tool for analyzing application and website traffic. It offers a demo version for users who want to test the solution. It allows you to trace the path of a user on your website from the beginning (the source from which they were redirected to the website) to the end. You’ll find out how many users have logged in to the website, used specific functionalities, interacted with the content, or made a purchase.
With Kissmetric, you can identify your customers' most frequently used functionalities of your application and the most frequently viewed subpages on your website. A thorough analysis of the user path will allow you to understand the reasons why the user is unable to complete certain actions (e.g. make a purchase). The tool allows you to get to know your customer better - not only their activity on a particular website but also their interests, whether they are a new user or a returning user. The most important feature of Kissmetrics is that it relates specific activities to a specific user, thus providing really detailed information about selected consumers and not just groups of consumers.
A company using the paid version of this solution has access to the support of a dedicated advisor, in the form of live chat or email. Kissmetric can be integrated with a range of business tools and platforms.
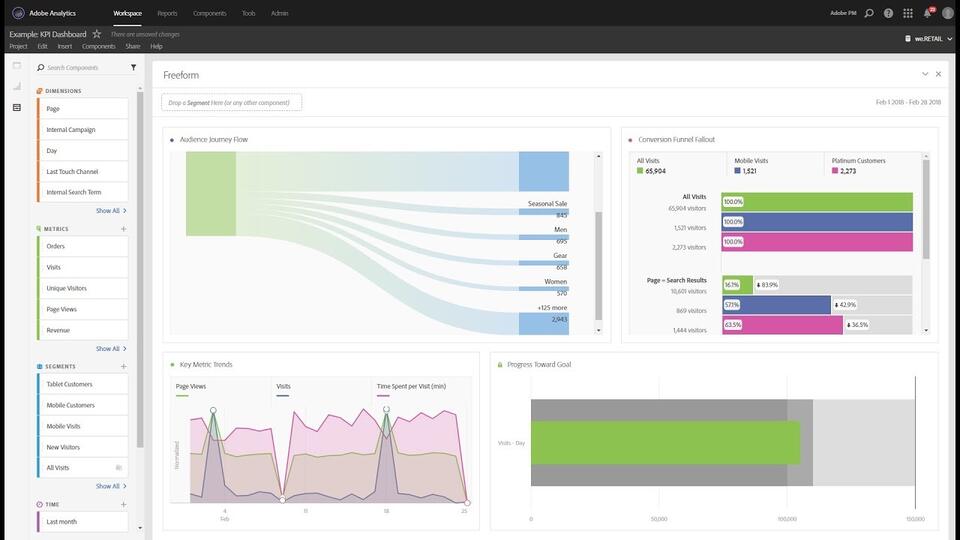
5. Adobe Analytics
Adobe Analytics is a paid tool that uses modern technologies such as machine learning and artificial intelligence (AI). You can test its functionalities by using the demo version. The tool provides high-quality, reliable reports on your website traffic.
Choosing to use this tool will give you access to detailed data about your customers - not just their path, purchase behavior, interests and preferences. You can choose from a variety of data types and metrics that you would like to see. In addition, Adobe Analytics allows creating segments based on information about groups of users for easier comparison of data.
Source: Analytics Mayhem
The tool allows you to monitor data in real-time, making it easier to effectively implement changes to campaigns or make adjustments to websites. Artificial intelligence and machine learning enable you to detect swiftly abnormal events (deviations from the norm) on a website, so you can take appropriate action quickly. Reports can be tailored to the needs of your business, and personalization of the interface visibly affects the speed of data presentation.
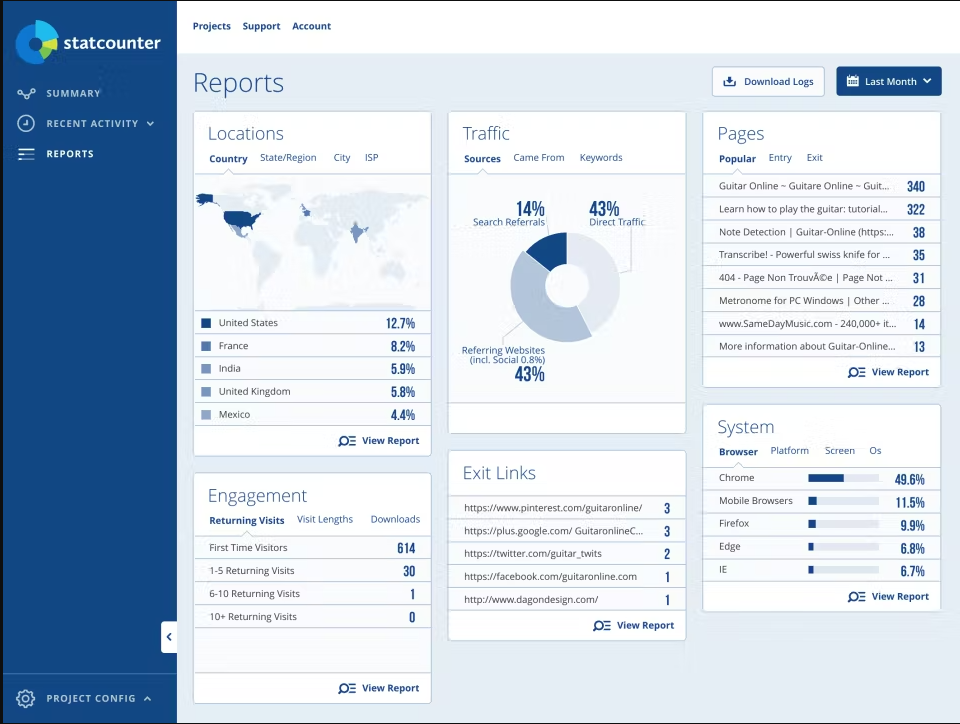
6. Statcounter
Statcounter is an analytics solution available in paid and free versions. It’s also possible to test a demo of the tool. Like other tools of this type, it allows you to notice negative and positive changes in your website traffic so that you can take appropriate action (e.g. modify your adverts). It also shows you details of paid and organic traffic. It’s even able to detect fraud that drains your budget without benefiting the company (so-called click fraud).
This web analytics tool provides information about traffic, its source, popular subpages on your website, as well as user demographics. It also indicates which links are clicked by users leaving your website. You can add labels for specific users, names, and notes, thus creating a personalized database to better manage your business contacts. The ability to set up notifications can also be a useful feature - you can receive an email or notification from the Statcounter mobile application when a particular user visits your website again.
Source: Capterra
Reports can be tailored to your needs, automatically generated, and periodically sent to your email address. You’ll also receive access to a convenient mobile application so that you can quickly see your website data at any time.
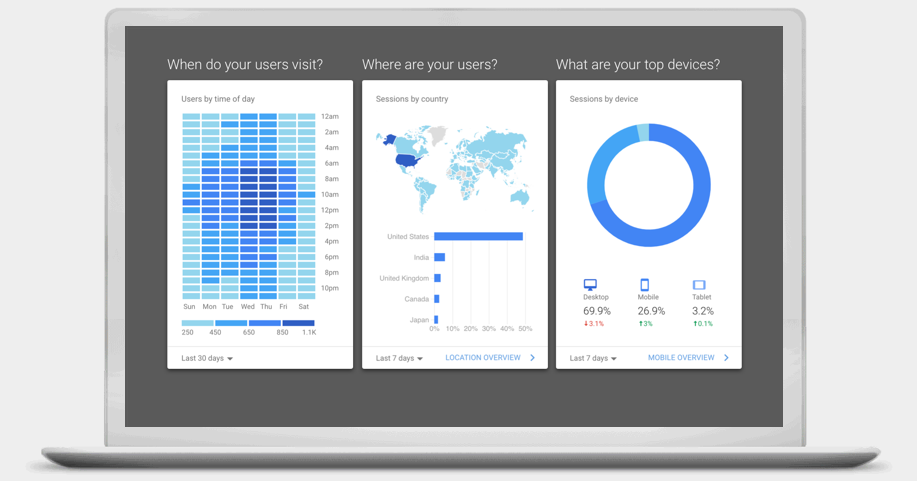
7. Google Analytics
Google Analytics is one of the best-known and most widely used tools for analyzing website traffic. This is certainly partly because it’s available for free. This version is limited in comparison to the paid version, although it’s often sufficient for many smaller and medium-sized companies around the world.
Google Analytics is used, among other purposes, to measure website traffic. Using it, you’ll find out the number of visitors to your website over a given period of time, as well as the bounce rates, conversions, and session lengths. The solution will also provide you with more information about the users themselves: their age, location, the devices on which they view your website, etc. You can also create user segments divided, for example, by their behavior on the website. All these data can be filtered to create more personalized reports. For a given analysis, you can choose data collected in real-time or historical data, focus on behavioral data, user acquisition, or conversions.
Source: Google Marketing Platform
The free version usually provides enough data for small and medium-sized companies. However, the requirements of corporations may be greater. Large companies may want to consider the paid version of this solution - Google Analytics 360 - which offers additional functionalities. The premium version guarantees the highest accuracy and timeliness of data - the data displayed in the interface are from up to four hours old. Users also get access to so-called attribution modelling. The attribution model learns from the data and shows you the links between the source of the traffic and the increase in conversions.
When considering the use of Google Analytics, it’s worth bearing in mind its primary advantage - easy integration with other Google products. You can start with the free version and upgrade to the paid version if you conclude that you need access to additional data and functionalities.
Combining the potential of Drupal and Google Analytics
Google Analytics can also be easily integrated with Drupal using a module with the same name as the original tool. This makes it much easier and more convenient to analyze a website built with Drupal. You don’t need to use a special module for integration because, to connect Analytics, all you need to do is add a small Google script to the website code. In practical terms, however, the use of the Google Analytics module will allow you to better tailor the analysis of your visits to your individual needs and enable you to eliminate elements from the statistics that aren’t relevant to you. You can change a few things, such as excluding admin from tracking so that your activity on the website isn’t counted in the statistics, or disabling tracking of selected locations. It’s also worth ensuring privacy and a good customer experience by allowing users to decide whether they want to be tracked.
What is web analytics - summary
There are a number of interesting web analytics tools that allow you to gain a better understanding of your users, their activities, and their problems when interacting with your website. Many of these web analytics solutions can be integrated into Drupal if you decide to develop your website with this technology. We’re referring here to Google Analytics, Kissmetric, and Statcounter, but also to those tools that we haven’t mentioned in our article, such as Tableau or Web Trends.
When creating websites, we equip companies with the necessary tools for efficient data analysis. Explore in detail what we do when developing company websites in Drupal.